Analysts have been calling for nothing but a crash this entire year...
What began as market volatility has become a market rout. First came the high inflation... then came the de-risking due to uncertainty around the Ukraine crisis.
As prices rose further and Russia's invasion of Ukraine progressed, investors started worrying about a new looming risk. Oil prices have surged in recent weeks alongside overall inflation due to sanctions against Russia further constricting the supply chain.
With concerns that high oil prices for a prolonged stretch of time could create uncertainty for management teams and delay growth plans, people are wondering if the economy will soon dip into a recession.
Most folks turn to the two-year and 10-year Treasury yield spread as a warning sign...
Treasury yields are typically seen as a representation of the "risk-free rate" and provide strong insight into market expectations for economic growth in the future. As the U.S. government is viewed as the safest possible place for investors to put their money, we can use U.S. bonds as the "riskless" baseline.
To better understand what yields are telling us about the economy, we can chart out Treasury bonds yields over time to form a "yield curve."
This is a favorite tool among economists to get an idea of where the market is going.
Looking at yields over various time frames – such as for Treasurys that mature in three months, two years, five years, and 10 years – can give an idea of whether investors expect economic growth to get stronger or weaker over time.
When long-term interest rates are higher than short-term rates, this creates a positive or normal yield curve. A positive curve reflects a normal economy, as a loan that comes due later should be riskier than one that is paid off sooner. This also signals that the market expects economic growth to build on itself in the future.
Meanwhile, an inversion of the yield curve has consistently signaled a recession, which is when short-term rates are higher, or appear riskier, than in the long term. An inverted curve means the market is expecting that, at some point in the future, growth will significantly slow down for a protracted period.
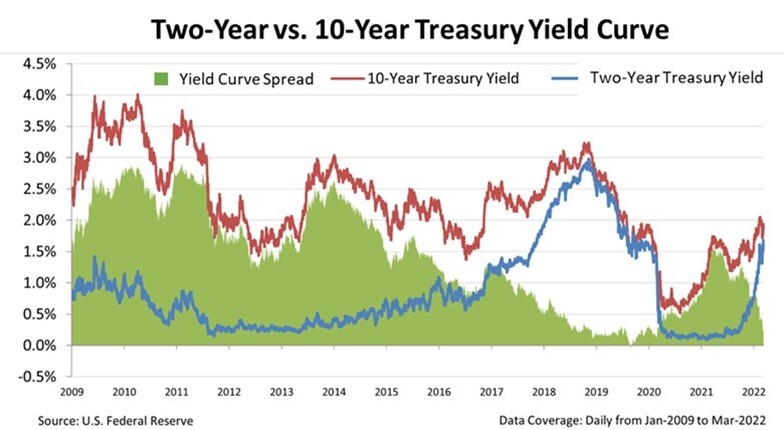
The chart below shows the current two-year and 10-year yield curves, with the red line representing the 10-year Treasury rate and the blue line showing the two-year Treasury rate. The green shows us the spread between the two.
As you can see, the two-year versus the 10-year yield curve is now at its tightest levels since just before the pandemic pushed the market into a recession in 2020. Take a look...
This has many pundits believing an inversion is imminent, which would then be followed by a recession.
However, as per usual on Wall Street, analysts are looking at the wrong numbers...
To understand the risk of recession, the two-year and 10-year curves together are of little help...
The yield curve is important, but most folks talk about the wrong one.
As regular Altimetry Daily Authority readers know, the yield curve that has consistently been predictive of a recession hasn't been the two-year versus the 10-year...
In reality, this curve has given false positives. For instance, it practically reached zero in 1984, 1995, and 1998, but we didn't see a recession in those instances.
On the other hand, the three-month versus the 10-year yield curve is significantly more accurate.
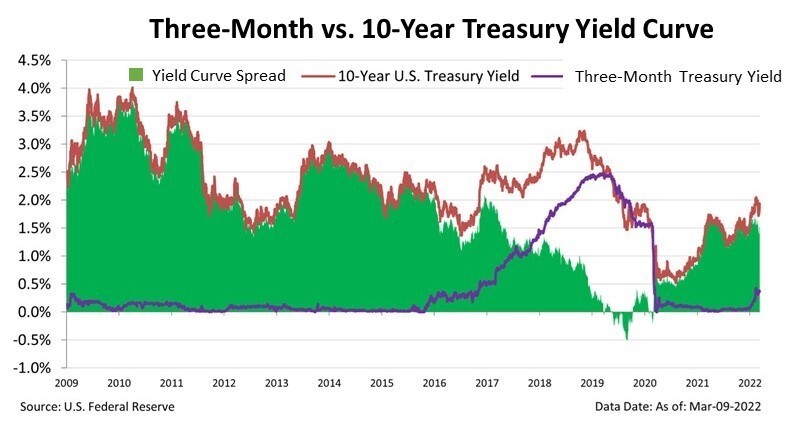
The next chart shows the three-month Treasury rate in purple, the 10-year Treasury rate in red, and the spread between the two in green.
In this case, using the three-month versus 10-year rate doesn't give any false positives. In fact, in every recession since 1982 – when the data first started being tracked – this yield curve has signaled a recession. In this specific version of the chart, we can easily see where the spread was close to zero in 2019.
While the two-year versus the 10-year rates may be getting closer, the distance between the three-month versus the 10-year rates is still quite comfortable. It's wider than it was in 2016, when we saw a healthy lending and credit environment.
This is one of the many reasons that while oil prices may give us slower growth in this quarter, there's little risk of a credit-driven collapse such as what we saw in 2008... Investors shouldn't be panicking right now.
Regards,
Joel Litman
March 21, 2022