You can probably guess what question we've received most often over the past few weeks...
If you've been reading our Altimetry Daily Authority issues recently, we've brought it up a few times... What does an epidemic or potential epidemic do to the stock market?
Everyone wants to understand the implications of the coronavirus on our outlook.
For the market, the real economic signals are far more important than the potential impact of this epidemic.
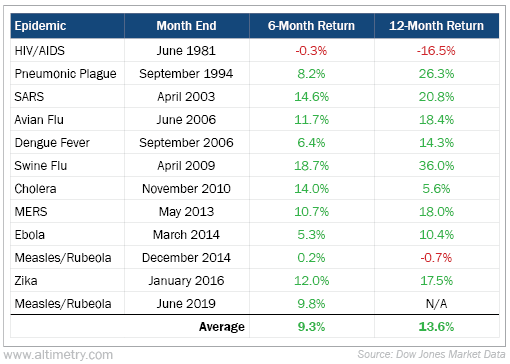
The data in the table below show all the major epidemics that have occurred since 1981, and then the six-month and 12-month return of the S&P 500 Index from after the concerns about the epidemic grew...
You might have expected to see massive drops every time, for a sustainable period... but in reality, there's no pattern at all.
This is more what we would expect. The data show that these types of issues are transitory for the market itself. What matters much more are the real fundamental factors, like the ones we focus on here at Altimetry.
We reviewed all our macro tips in one article last Wednesday in the midst of the pullback, which you can read again here.
Times of panic in the market are often an opportunity for investors who have a sound process and conviction in their outlook.
First and foremost, stay safe and healthy. But also, stay process-driven with your investments. Otherwise, you'll be chasing the tape... like so many others are doing right now.
We often talk about the importance of monitoring credit to understand economic growth...
Debt is a complicated issue.
If you've ever taken an introductory macroeconomic class, you've probably heard that debt is one of the biggest drivers of growth.
When used correctly, it's a tool to grow faster than otherwise possible – whether in the case of a country, a corporation, or even an individual.
For example, many people can relate this to buying a home. It's not feasible for everybody to buy a desired home with cash... but with a mortgage, homebuyers only need to shell out cash for a smaller 5% to 20% down payment of the house's value – the rest can be funded with debt.
Of course, too much debt can have the opposite effect. If a company takes on more debt than it can possibly pay off, it's harmful to growth... and if on too wide of a scale, it's also harmful to the economy.
This is exactly what happens during nearly every recession. For example, during the dot-com bubble, unprofitable tech companies grew too fast without focusing on turning a profit. After many of these businesses (or their customers) failed to pay their debts, the bubble burst and the economy contracted.
The same thing happened during the Great Recession. Lenders were too eager to give Americans debt for homes, sometimes offering loans to people who normally wouldn't qualify.
One particular type of loan became popular leading up to the recession – the so-called "NINJA" loan – which stood for "no income, no job, no assets." Banks were too eager to lend to fuel growth, and they ignored their usual lending standards.
In cases like this, debt causes more harm than good.
Because of how credit cycles help begin and end recessions, we make sure to monitor loan growth as part of our market analysis.
Coming out of the Great Recession, loan growth proved to be one of the most valuable indicators for our economic recovery. Historically, a recovery of lending growth has been one of the surest signals of the emergence of a bull market and economic growth.
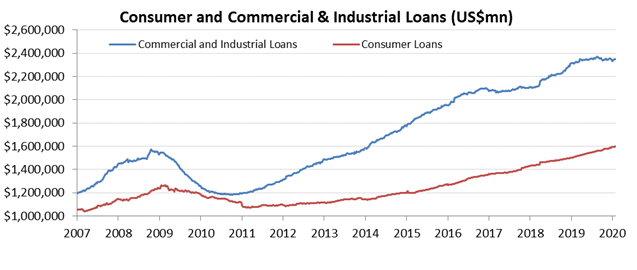
Along with corporate debt, we pay close attention to Commercial and Industrial (C&I) loans...
These loans are debt used by businesses as opposed to individuals. The loans are generally floating-rate, and they can be shorter-term in nature. They're an important indicator – especially coming out of a recession – because they're a good proxy for economic activity and growth after an economic downturn.
The longer a bull market lasts, the weaker this proxy becomes. It's not nearly as valuable to monitor C&I loans leading up to a recession because they can often lag the market, or the relationship breaks down entirely. Companies still want to borrow even in the midst of the initial slowdown, because all they see are opportunities.
For example, C&I loans kept growing throughout 2008, and they're currently holding steady...
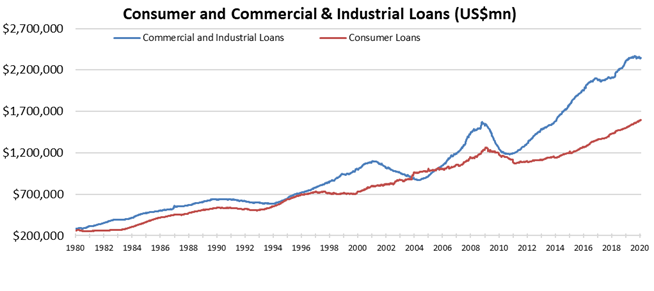
They stagnated during 2016 and 2017 without an economic drawback. And if we look back all the way to 1990 through 1994, the same phenomenon occurred...
But that being said, as the above chart shows, every acceleration of C&I loans has lined up with stronger economic activity and a bull market. C&I loan growth is a powerful leading indicator of a positive inflection in economic growth.
Since we're so focused on credit, many would assume we would be nervous about recent stagnation in C&I growth. But as the analysis shows, these data aren't relevant as a leading indicator ahead of slowing economic growth.
Whenever we do see an economic downturn, it will be more important to pay attention to C&I loan growth as a sign coming out of the recession.
In the meantime, aggregate credit continues to grow, based on the combination of C&I and consumer credit. It's another signal that this bull market may not be ready to call it quits just yet.
Regards,
Joel Litman
March 2, 2020