It's a short squeeze for the history books...
We avoided discussing the wild moves in video-game retailer GameStop's (GME) stock last week, because discussing fundamentals when an event like that is unfolding becomes meaningless. And yet, we were certainly watching with amusement and horror from a distance... along with much of the investing world.
With things having calmed down a bit, we can jump in with more context after giving the story time to develop. Regardless, the data are staggering...
GameStop has approximately 70 million shares outstanding. But for multiple days last week, the stock traded more than 170 million shares. This indicates that the average liquid share outstanding changed possession almost two-and-a-half times.
The company's short interest – the percentage of shares outstanding that people had borrowed and sold onto others, betting that the stock would go down – consistently hovered over 100% the past few weeks.
With such high short interest, when the mob started pushing the stock higher, it led to a feeding frenzy. Funds had to buy at any price to cover their bets that the stock would go lower.
GME shares rocketed from $20 on January 12 to an intraday high of $483 on Thursday. That doesn't even really do justice to the move, though. To better understand, think of it this way...
Three weeks ago, the world thought GameStop's market cap was worth $1.4 billion. At GameStop's peak a few days ago, the market was telling you GameStop's equity was worth $33.7 billion.
Before last week, the highest GameStop's market cap had ever been was around $10 billion... and that was years ago!
This rise in stock price had little to do with GameStop's fundamentals. The wild moves happened due to a battle between established short sellers and an upstart collection of day-trading users of discussion site Reddit's WallStreetBets forum. (News website Vox gives a good, simplified explanation.)
That said, the craziest leaps often start in the realm of logic...
GameStop had already risen by roughly 4 times from August to early January of this year, before the short squeeze came into effect.
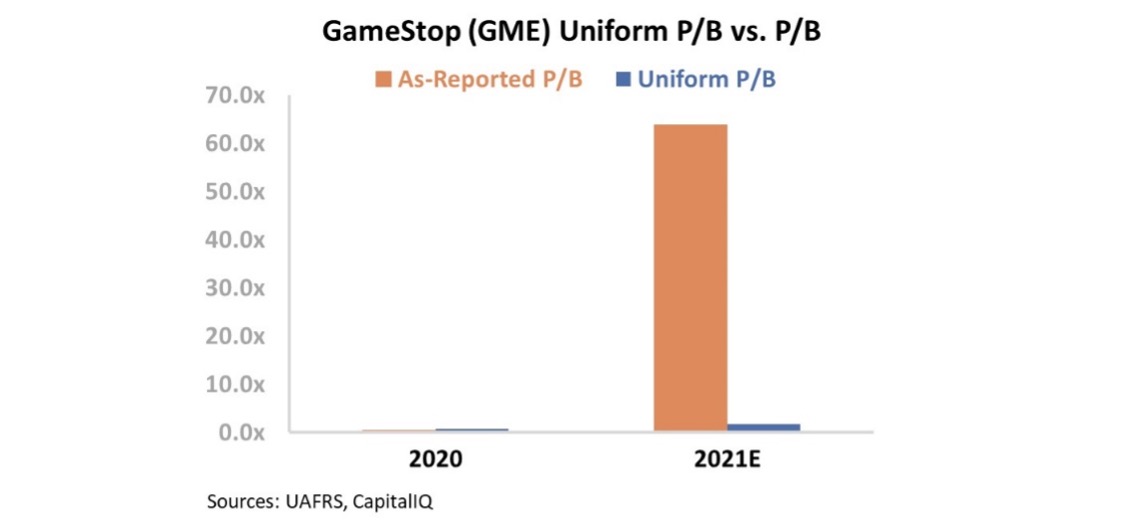
From the bottom at the beginning of April, GME shares were up more than 600%. Back then, GameStop's market cap was $180 million, and it was trading at a Uniform price-to-book (P/B) ratio of 0.7. These levels are set for companies that are at imminent risk of default.
So why was the stock trading at such a deep discount to begin with? It was because many investors were pricing in a solid chance of bankruptcy for the company.
One part of this perception was because the major credit-ratings agencies were skittish when rating GameStop's debt. Specifically, Moody's (MCO) gave GameStop a high-yield "B3" rating, with the implied assumption of a 10%-plus risk of default over the next five years.
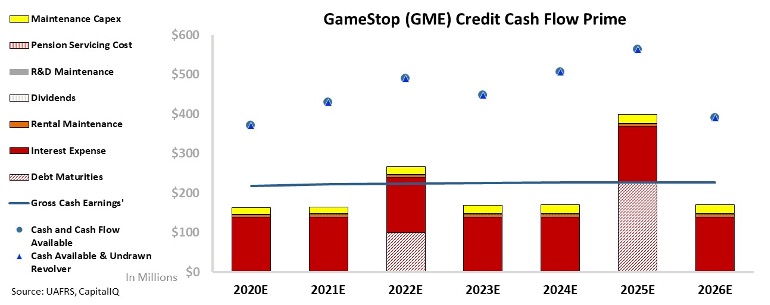
However, our Credit Cash Flow Prime ('CCFP') analysis is able to get to the heart of the company's true credit risk...
In the chart below, the stacked bars represent GameStop's obligations each year for the next five years. These obligations are compared to the company's cash flow (blue line) as well as the cash on hand at the beginning of each period (blue dots) and available cash and undrawn credit revolver (blue triangles).
As you can see, GameStop has massive cash liquidity and should have no issues handling its obligations going forward. On top of this, even if the company didn't have access to this capital, cash flows alone exceed all operating obligations every year – including 2022 and 2025, when the firm has debt maturities.
This means Moody's high-yield rating – with more than a 10% risk of default – makes no sense. As our CCFP highlights, the perception of imminent bankruptcy risk was never real for GameStop.
This meant for most of 2020, the markets were overstating the company's credit risk... and investors came to realize that over time. By mid-January, when GME shares reached $20, the market was no longer pricing in that risk.
And yet, the market still wasn't exceptionally bullish on GameStop...
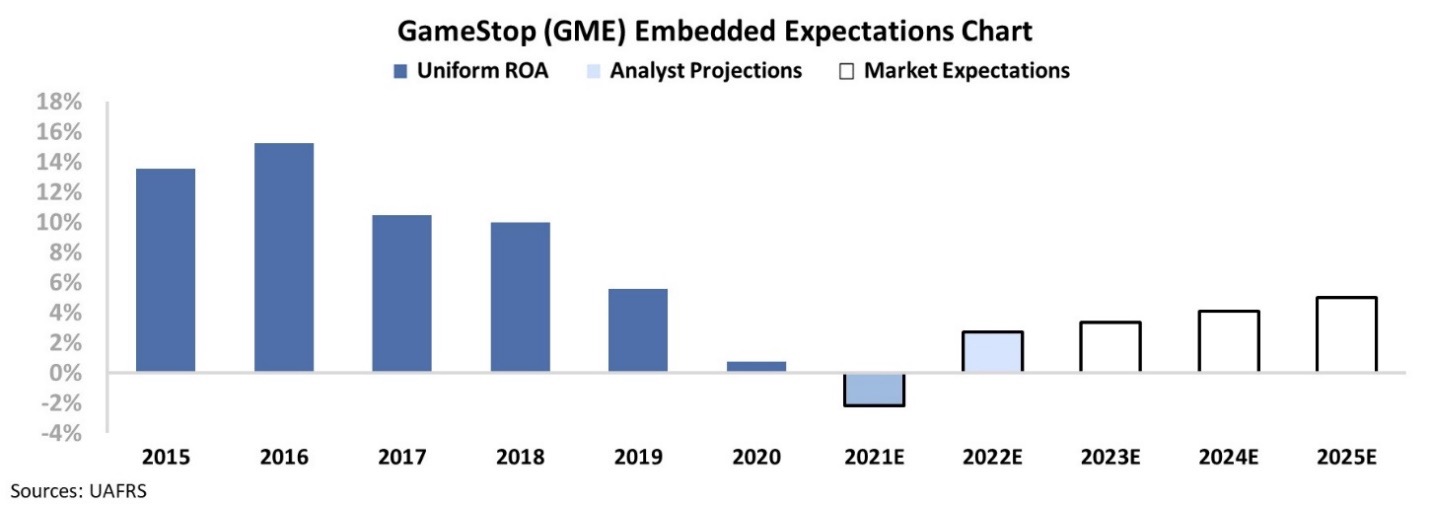
When looking at the company's embedded expectations before the short squeeze, we can get an understanding of what the market was thinking.
In the next chart, the blue bars show GameStop's historical performance. The light blue bars represent analyst expectations for the future, with the white bars serving as the market's expectations when the stock was trading for $18 per share.
Even after GameStop's steady improvement through 2020 and with an $18 stock price before the short squeeze, investors were only expecting returns to reach 5% in the following years. Take a look...
Now, expecting a full recovery to 2016's profitability levels may be unreasonable...
As they lose popularity or suffer from disruptive competition, many retailers struggle to ever fully recover from collapsing returns. So it was reasonable for investors to be expecting GameStop to see returns move higher... but for the recovery to be "incomplete." That's what the market was pricing in with GME shares at $18.
And it was also reasonable for other people – some of whom appeared to be posting on Reddit's WallStreetBets – to look at that same fundamental picture and see a possible bullish scenario. If GameStop's new management team could fully turn the company around – and returns didn't just move to 5%, but climbed to 10% or greater – GME shares could be worth a lot more than $20.
And that's where this craze took off... with a rational nugget of understanding market expectations. But since then, it has certainly snowballed into something much different.
While the short squeeze and ongoing volatility have been crazy, its basis at least started in reality. Only after that – once the sharks smelled blood and mania took over – were all fundamentals left behind.
Regards,
Rob Spivey
February 2, 2021