China has spent the past two decades transforming itself into an industrial superpower...
The country now controls more than 40% of global refined copper, lithium, and rare earth metals. These resources are essential for making everything from electric vehicles to fighter jets.
It's almost impossible to exaggerate how powerful Chinese industry has become. A single Chinese shipbuilder produced more tonnage last year than the entire U.S. shipbuilding industry has managed since World War II.
And with 162 million factory workers – nearly triple the combined total of all NATO countries – its manufacturing dominance looks unshakable.
China's rise has triggered alarm bells across the Western world. In a future conflict, industrial scale might matter more than technology.
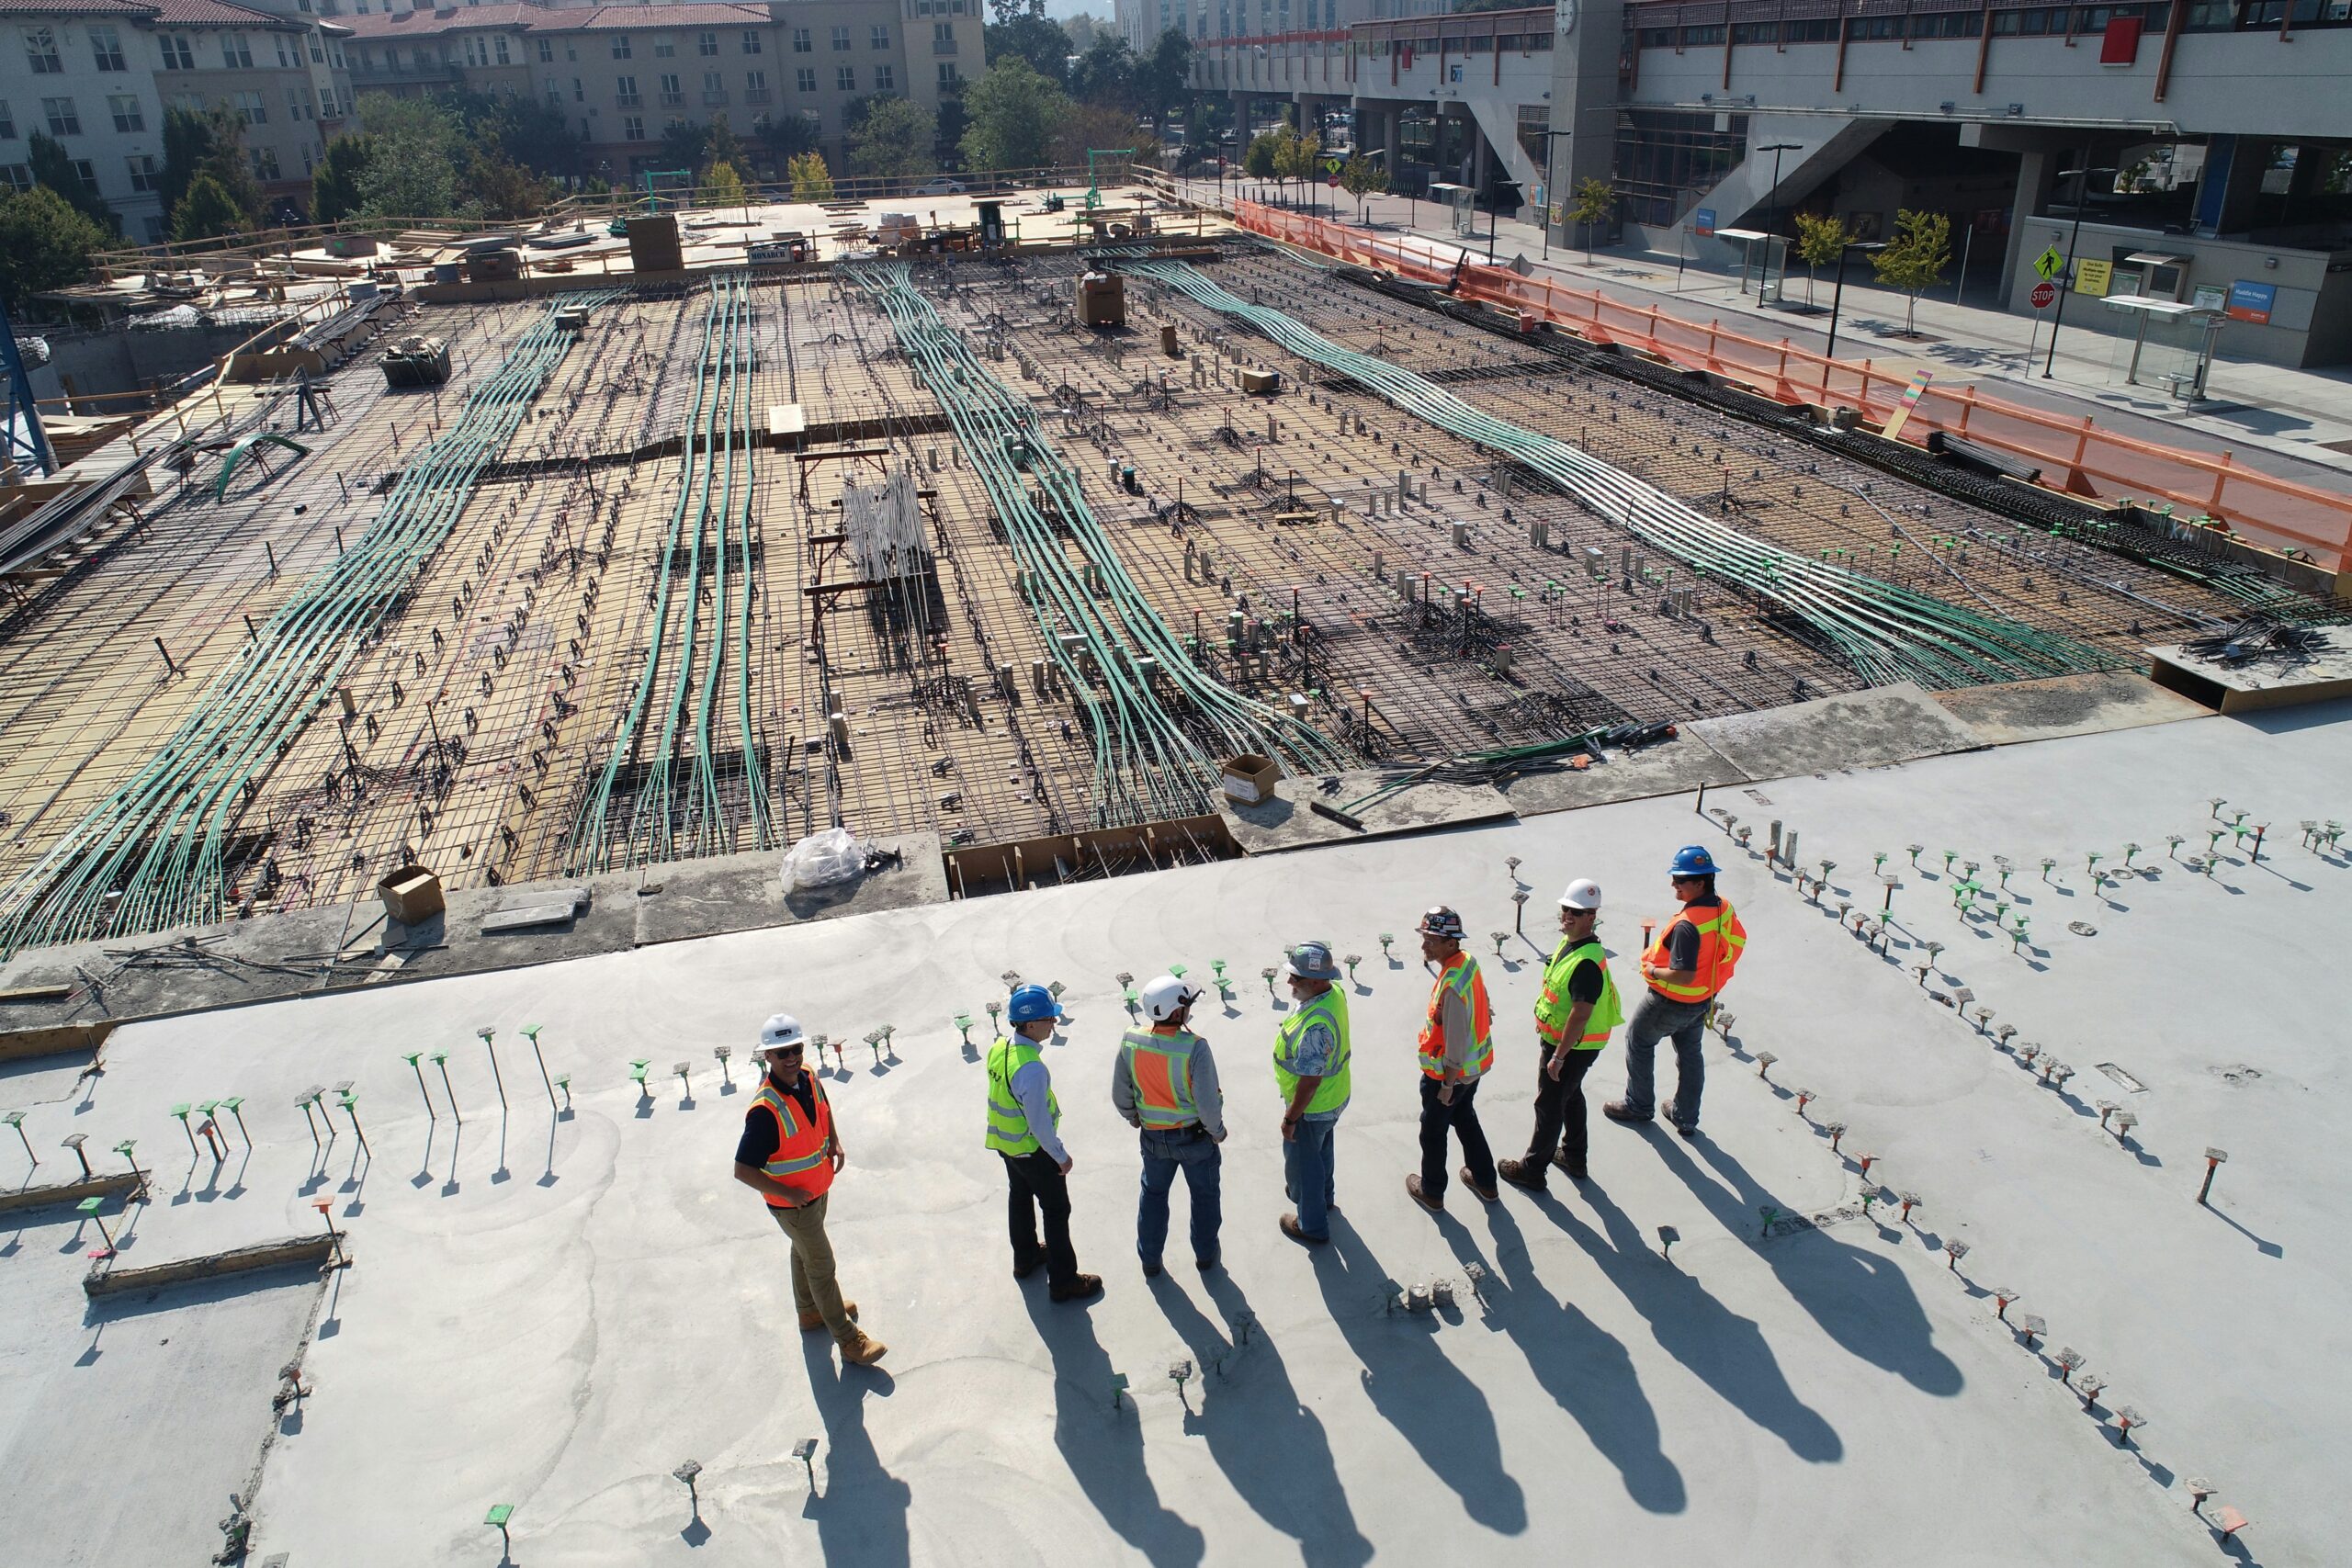
No wonder the U.S. is doing something it hasn't done in decades... rebuilding its industrial base.
We're entering our biggest domestic investment cycle since before the Great Recession...
Each of the past three administrations has taken steps to reignite domestic production.
In his first term, President Donald Trump implemented Section 232 tariffs on imported steel and aluminum... pushing manufacturers to source metals from within the U.S.
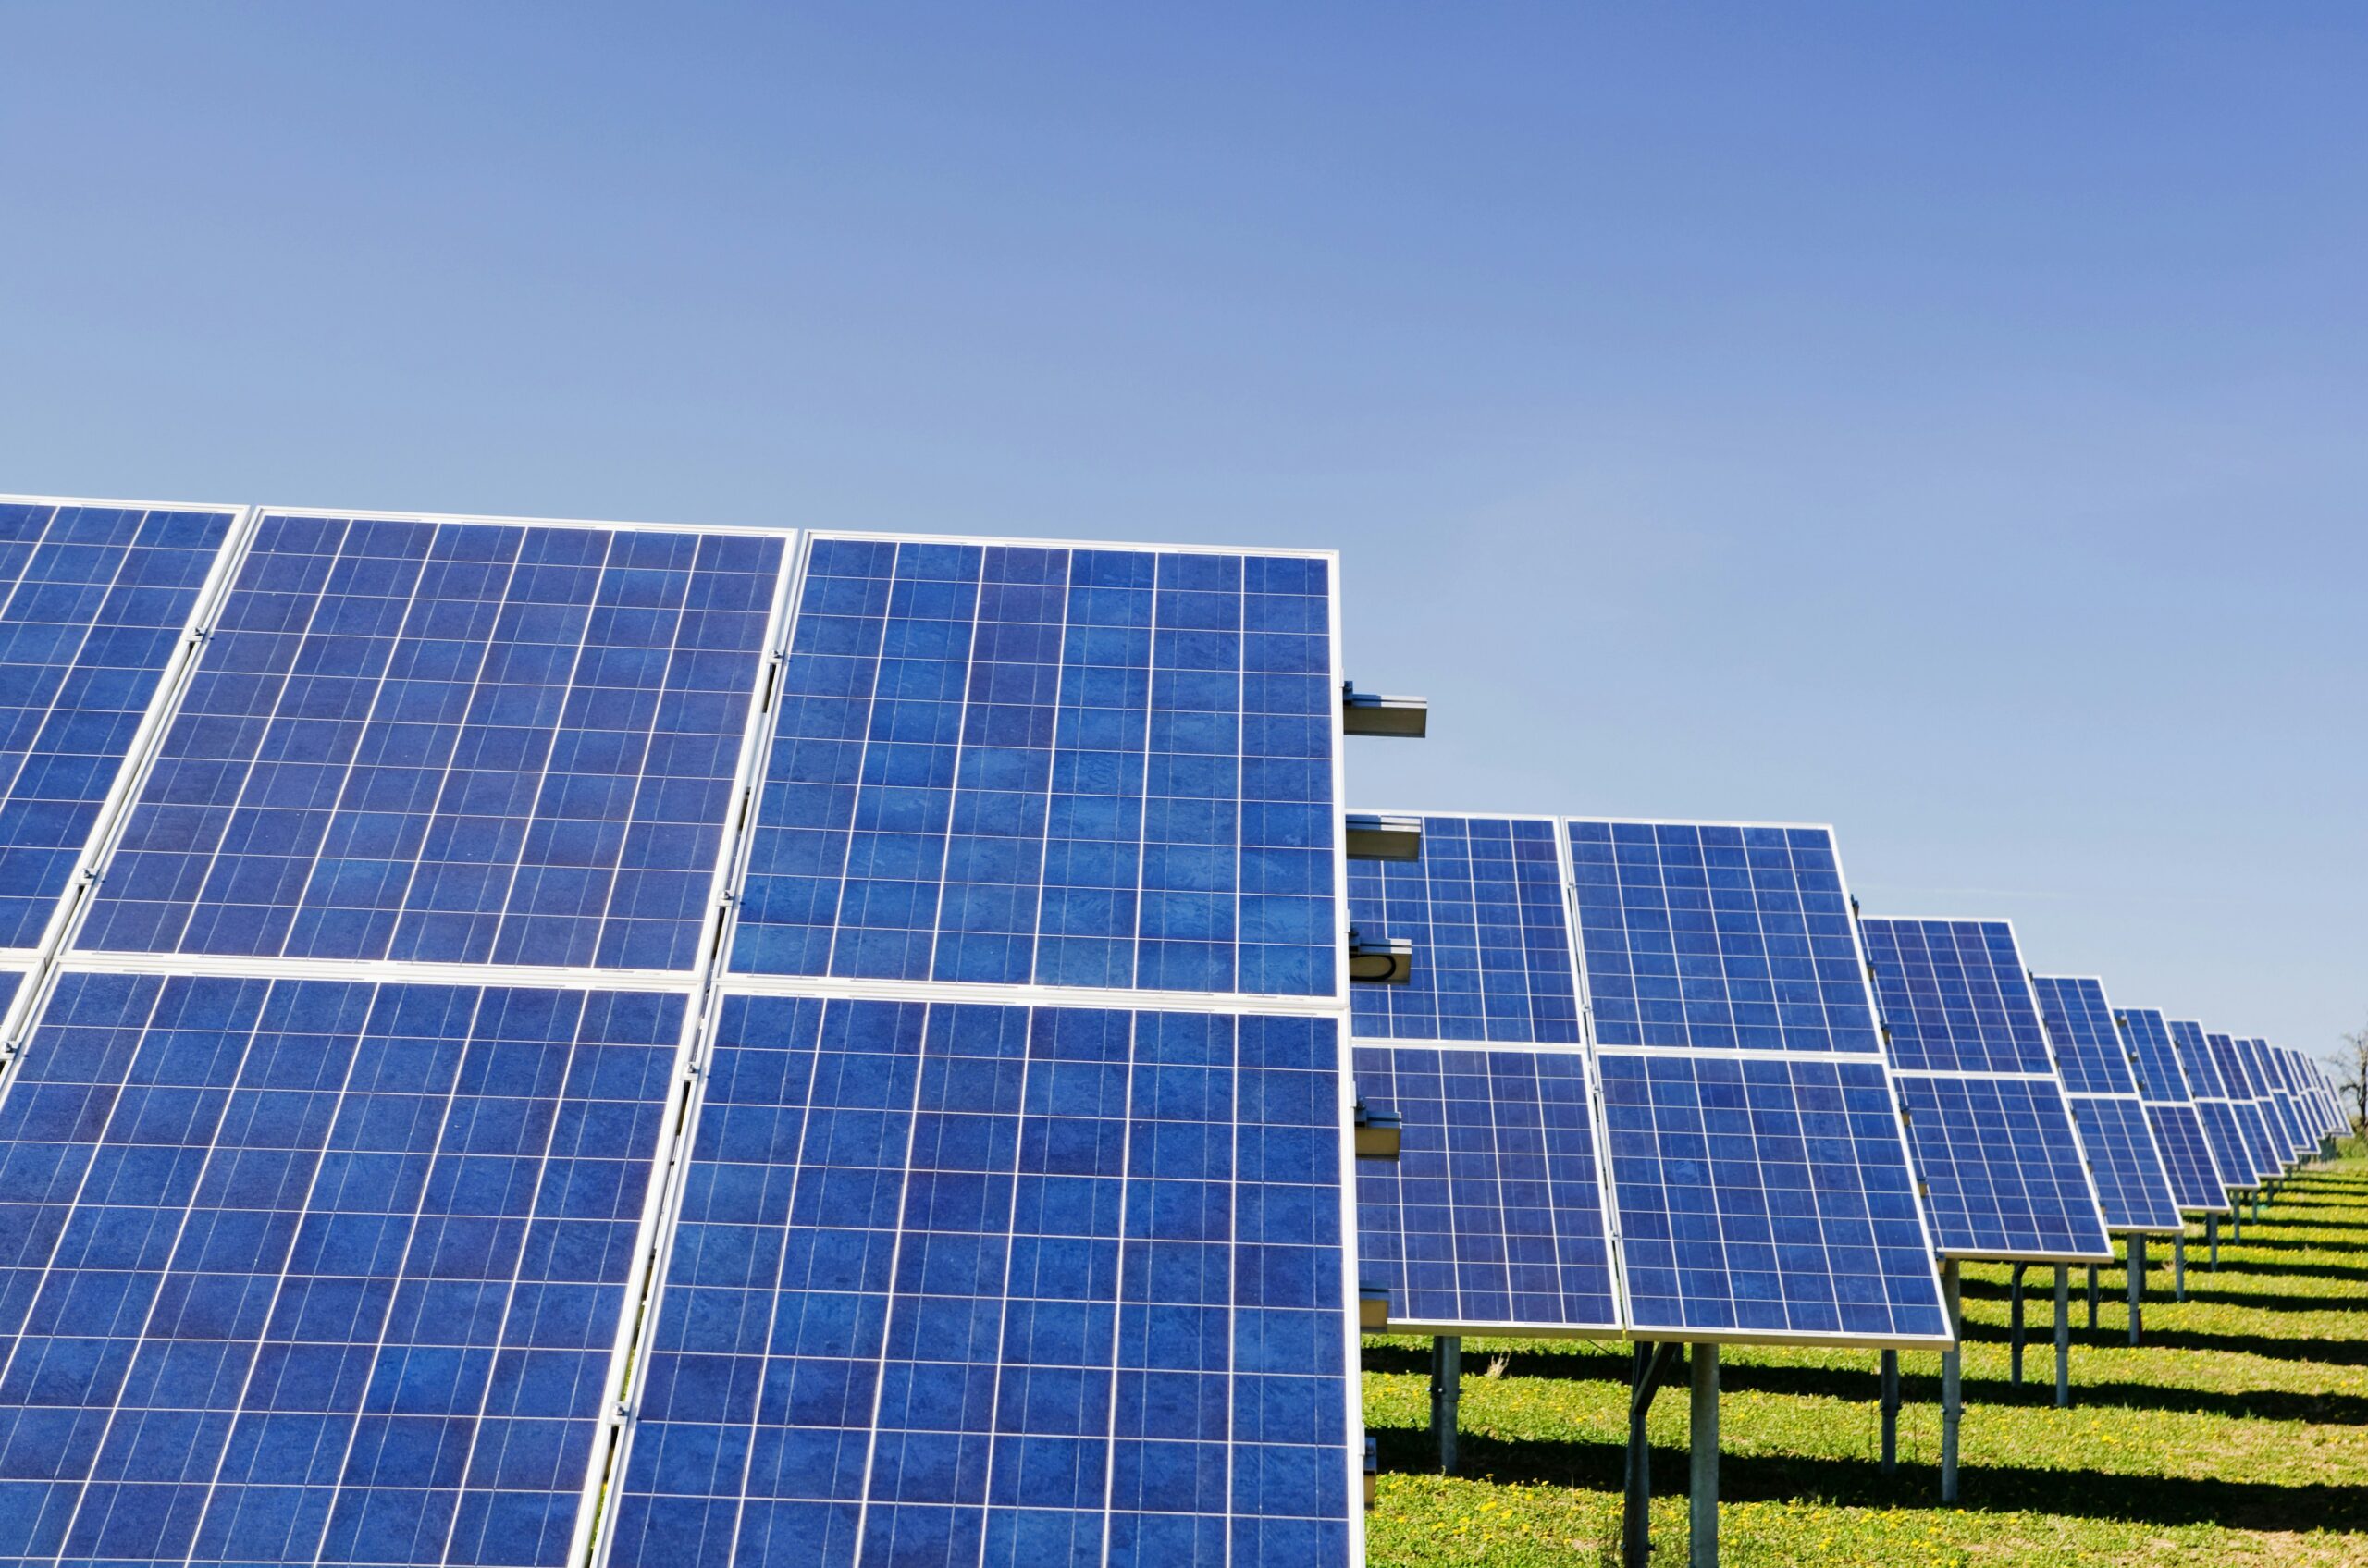
Joe Biden followed this up with the Infrastructure Investment and Jobs Act. The bill unlocked $1.2 trillion for American roads, railways, broadband, and clean energy projects.
And as we know, in his second term, Trump has doubled down on tariff-driven policy. He's expanding duties on foreign-manufactured goods to incentivize local production.
These efforts are designed to make domestic sourcing more competitive. And they aim to further discourage U.S. companies from relying on offshore suppliers.
It takes time for initiatives like these to sway the economy...
But we're already seeing some changes.
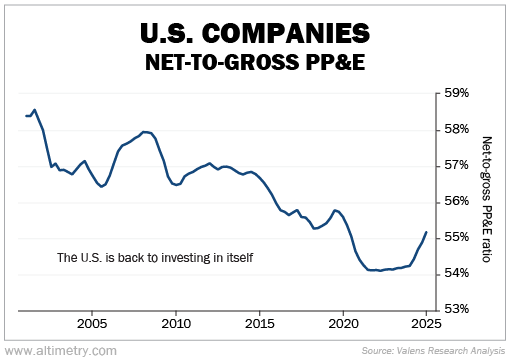
To get a better sense of what's happening, we can look at the net-to-gross property, plant, and equipment (PP&E) ratio for the whole U.S. economy.
Gross PP&E represents the value of a company's assets when they were acquired. Net PP&E reflects their current value. So the ratio indicates the age of assets... The lower the ratio, the older they are.
It's a good indicator of how much money we're investing in our country.
In 2001, the net-to-gross PP&E ratio sat between 58% and 59%. Said another way, the average company's assets were roughly 40% through their usable life.
By 2010, that metric dropped to between 56% and 57%. While it started ticking up by the end of Trump's first term, the pandemic took a toll. Companies put their investments on hold.
And by early 2021, as we emerged from the worst of COVID-19, the net-to-gross PP&E ratio had dropped to 54%.
But that trend started to reverse in 2022. The age of assets fell slowly at first... and really took off mid-last year.
We haven't seen acceleration like this since before the Great Recession...
Companies are pouring capital into domestic factories, logistics centers, and supply chains. Trends like data-center buildouts are making the rise even faster.
And because the current administration is still pushing for investment, this cycle could last for years.
It's hard not to look at China's scale and feel like the U.S. is falling behind...
But scale alone doesn't determine leadership. The U.S. is still the world's best growth engine. We're regaining the capabilities that once made us the global industrial leader.
Decades of neglect left U.S. industry brittle. Now, capital is finally flowing back in.
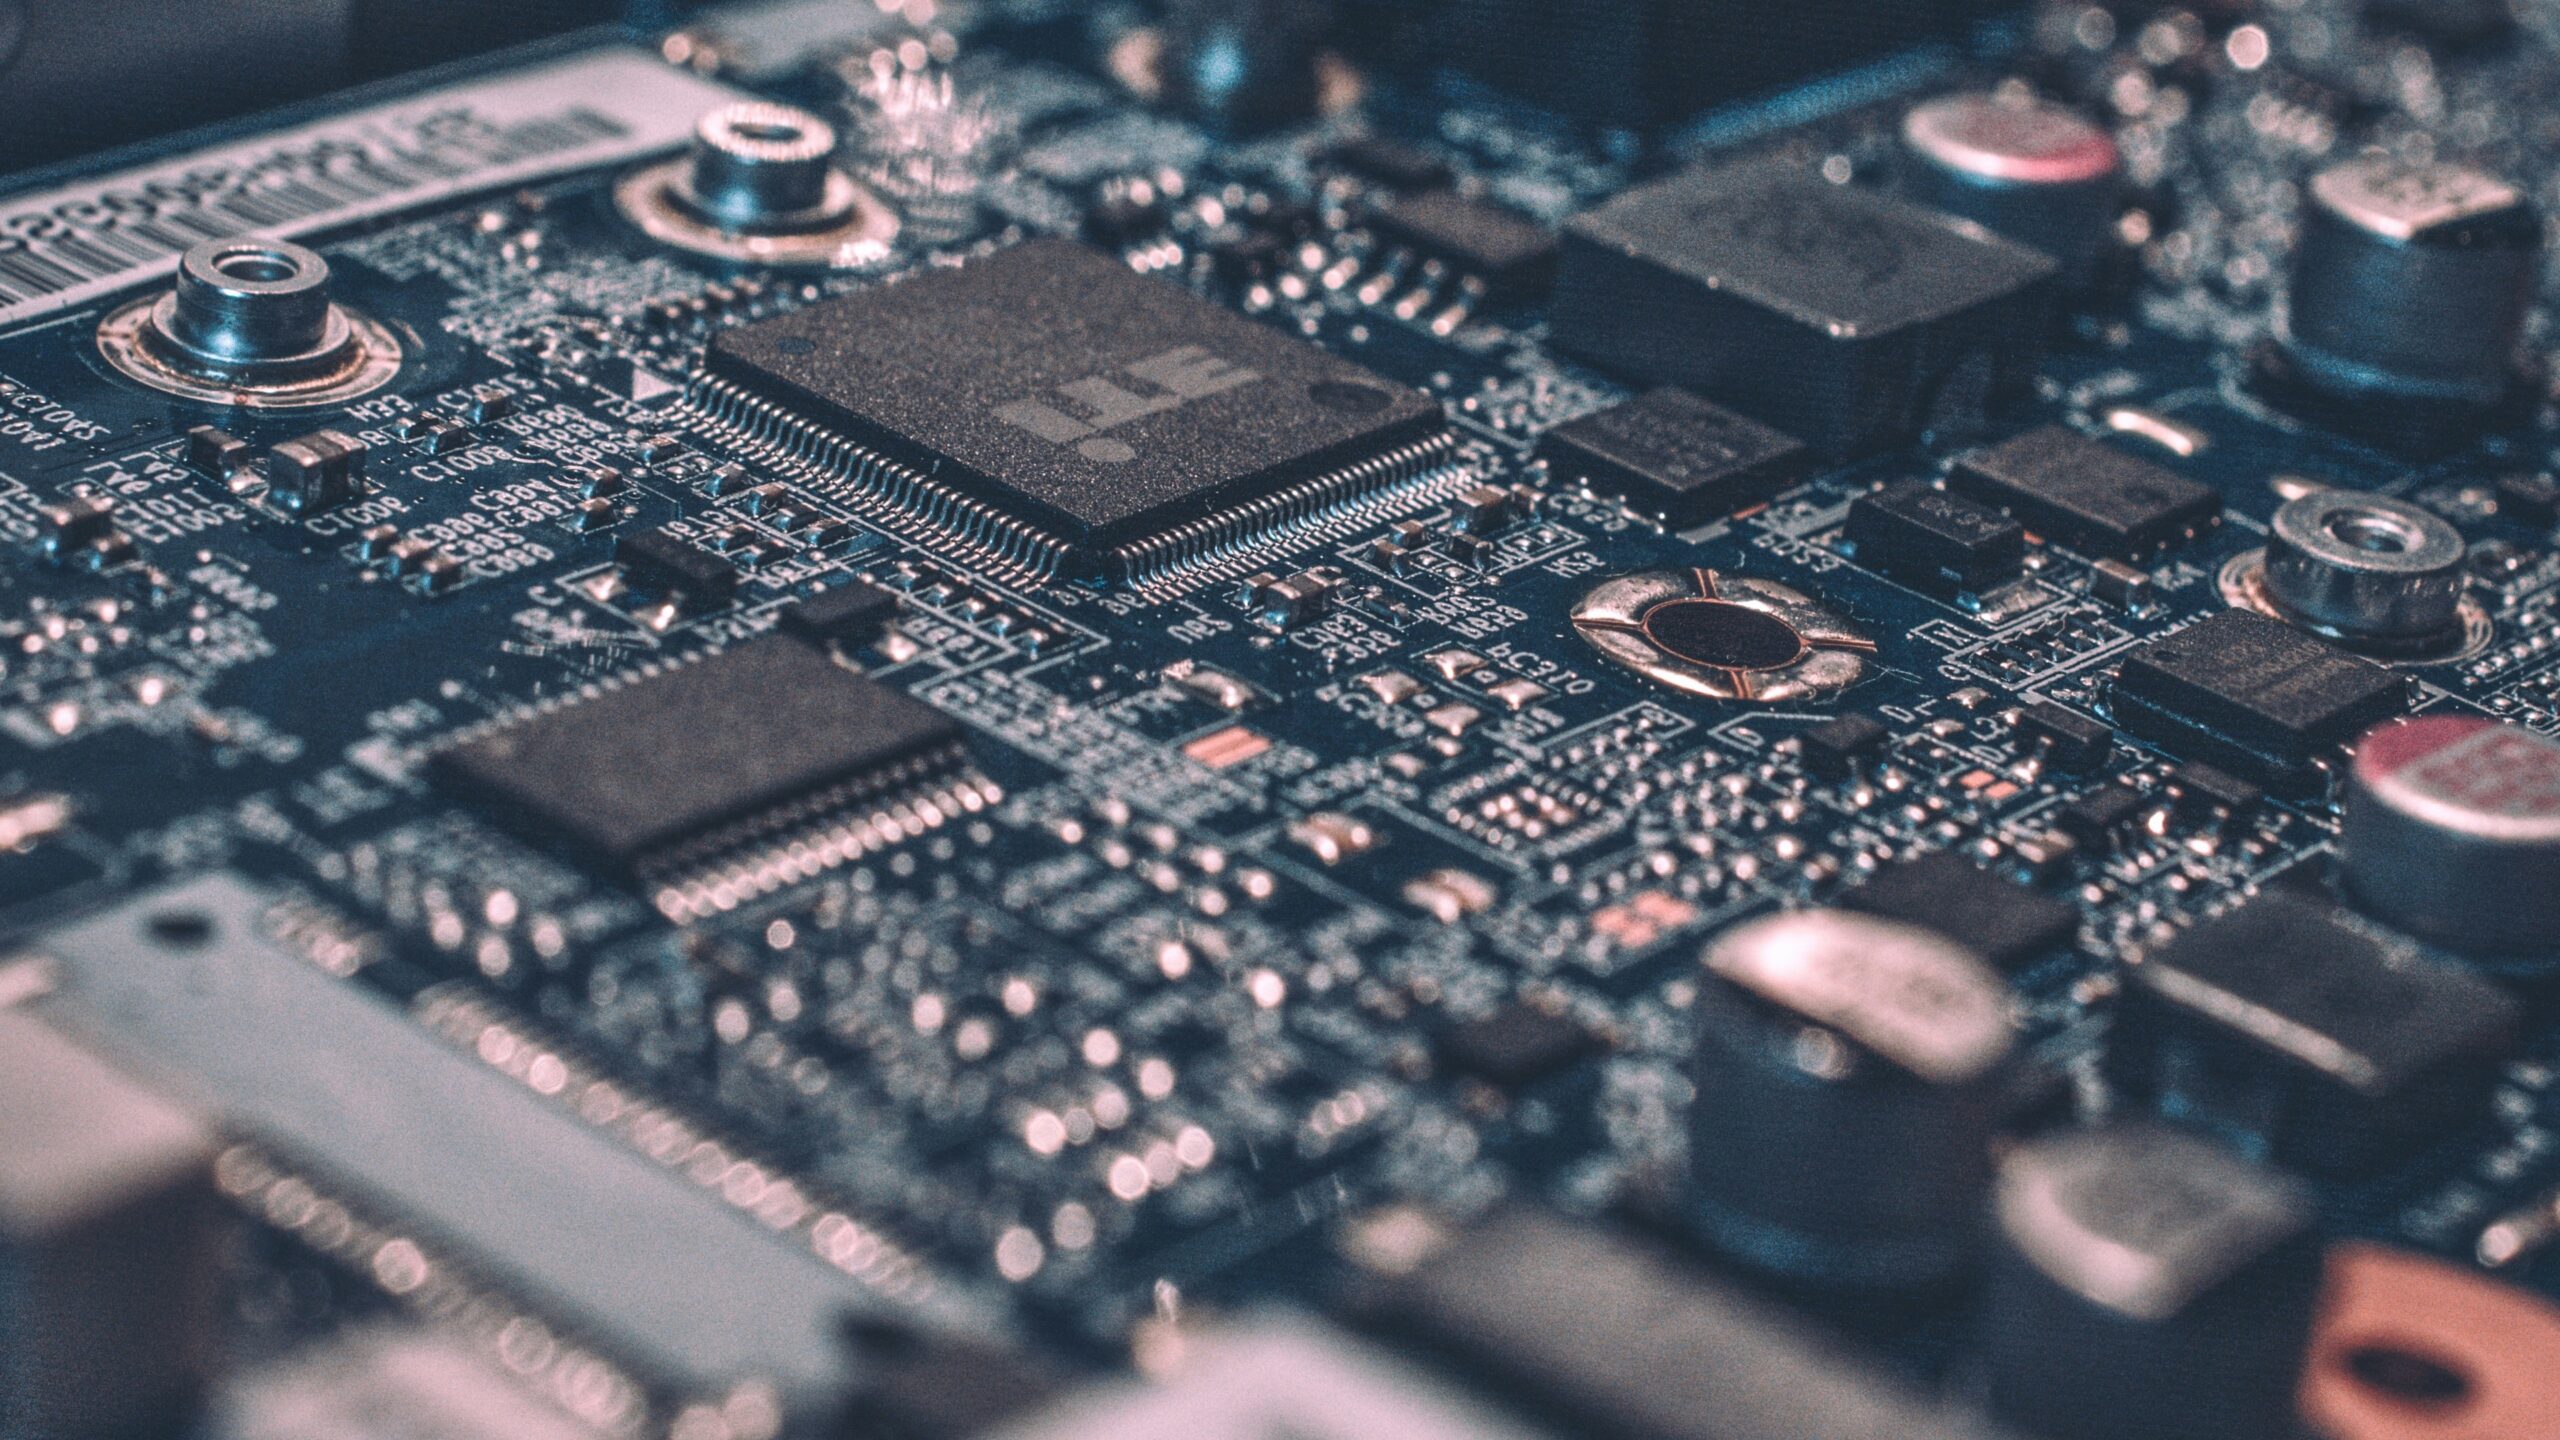
Companies are retooling their manufacturing hubs. Strategic sectors like semiconductors and shipbuilding are seeing their first real reinvestments since the 1990s.
The data is clear. Asset investment is accelerating across the board.
U.S. businesses are preparing to compete... and thrive.
Regards,
Joel Litman
June 23, 2025