Bloomberg found a creative way to track the return to normalcy...
Investors and management teams are trying to assess the effect of the delta variant of the coronavirus on corporate America's return to the office.
We think about it, too, from both sides: as investors and from a company management perspective. As a firm, we are trying to balance our team's health, happiness, and productivity.
Yesterday, we kicked off a micro-series on the delayed "return to office" theme in Altimetry Daily Authority. Today, we highlight one of the more "left field' ways of understanding the "return to office" momentum with the Pret Index.
Bloomberg uses this index as a proxy for the return to major metropolitan downtown offices. For those who haven't spent a lot of time in the business districts of New York City, London, or other global cities, Pret A Manger is an international sandwich shop that sells prepacked eats, croissants, and coffee.
The specific metric in question is transaction volume for the chain, or the total number of products sold. While not perfect, it does a fairly good job of representing the economic reality of the once-bustling downtown areas that became ghost towns once the coronavirus pandemic struck.
Bloomberg's most recent tracking report shows that the index is only at 32% of pre-pandemic levels in downtown New York City and 47% in the city's Midtown area. The only locations where the Pret Index sits higher than pre-pandemic levels are in the London suburbs.
This highlights the homeward shift away from the office. The data is simply astonishing. Despite what many perceive to be a "return" to pre-pandemic life induced by mass COVID-19 vaccinations, at most locations, the index still sits much closer to where it was in March and April 2020 than where it did pre-pandemic. In other words, the "return to office" movement is struggling.
Worse yet, the trend of an improving Pret Index has reversed in recent months. Both of the New York City areas are seeing lower volumes compared with a month or two ago.
While many are using the Pret Index as a proxy for overall economic activity and as a tool to understand the shift back to the office, it also clearly spells trouble for Pret A Manger itself.
But there are other companies whose lifeline is the lunch hour in major business districts...
One such company is Potbelly (PBPB).
The Chicago-based Potbelly is close to the hearts of many on the Altimetry team. I went to DePaul University and spent a lot of time earlier in my career in the Windy City, and many members of our analyst team have helped teach classes at DePaul. One of our team members is based there now.
We all appreciate how delicious Potbelly's sandwiches are. However, and it breaks my heart to say this, the current environment is causing Potbelly's stock to struggle.
Potbelly's volumes are down without the foot traffic through the company's downtown locations, just like Pret A Manger's. Nevertheless, employees and rent still need to be paid, and the lower volumes and compounding supply chain pressures make bulk ordering more difficult, forcing prices upward.
It's a perfect storm. But many investors are moving forward with the thesis that the hard times in the food and restaurant business present a compelling entry point.
Potbelly shows that investors need to comb through the data before drawing such a conclusion...
To remain objective and efficient when looking at company data, we use a framework we call the Embedded Expectations Analysis. It leverages the full power of Uniform accounting to quantify the future performance already priced into a stock.
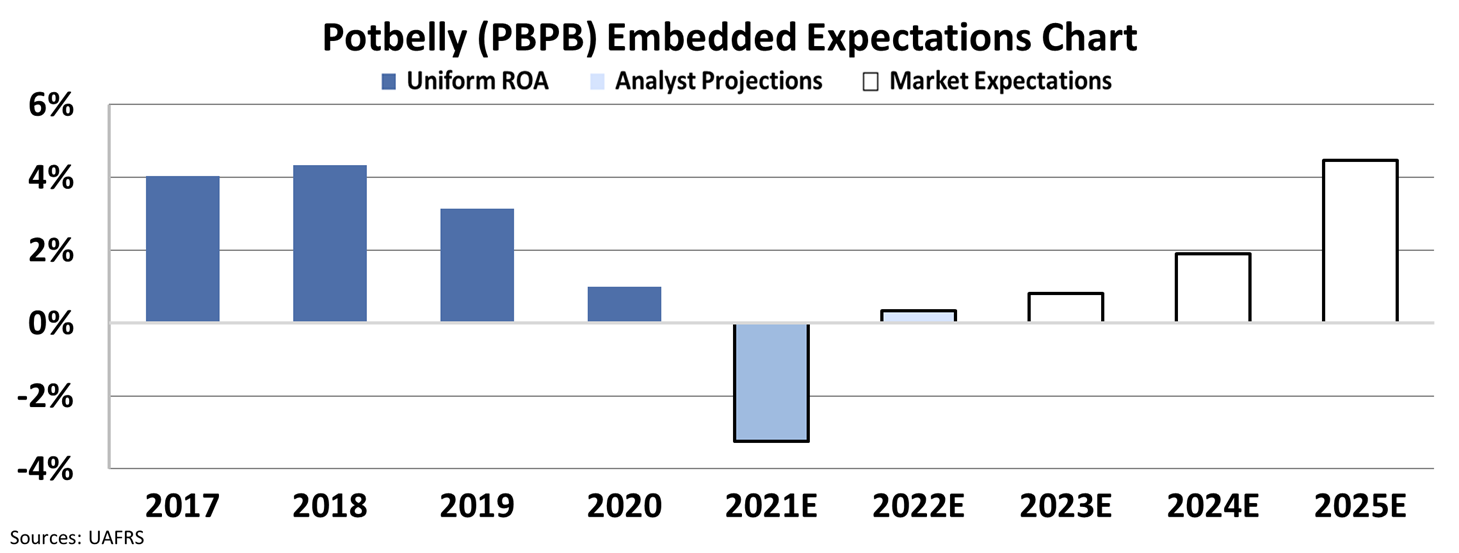
When looking at Potbelly, we see that its Uniform return on assets ("ROA") hasn't even touched the cost of capital, around 5%, in the past four years. We see that even before the pandemic, Uniform ROA was steadily declining to almost zero last year.
It is expected that when management files its annual report for 2021 early next year, Uniform ROA will have slid down past negative 3%.
But at current valuations, the market is expecting Uniform ROA to not only return to positive levels but hit 5% in 2025 while modestly growing its asset base by 3% per year. This level of performance wasn't even sustainable in the economic boom before the pandemic.
See our Embedded Expectations Analysis chart for yourself. The blue bars represent historical Uniform ROA. The light blue bars represent the aggregate expectations among analysts following the stock, who spend each day researching and deepening their understanding of market conditions and the company's specific initiatives. Finally, the white bars represent the future company performance that would justify today's valuation.
As the company contends with lingering pandemic issues, we are hard-pressed to believe that the performance justifies today's valuations.
While this isn't a nail in the coffin for the company's stock, it is a sign that investors might be disappointed when Potbelly only returns to its pre-pandemic normal operating procedure, rather than what everyone is expecting.
It also shows that although restaurants have been hammered during the pandemic, it is not a given that these businesses are priced at attractive entry points.
For many, the recovery is already priced in. Investors expect nothing short of a complete turnaround for names like Potbelly, even compared with pre-pandemic performances.
Here at Altimetry, our Uniform Accounting analysis helps investors understand which companies are mispriced due to bad GAAP financials...
Each month, in our Altimetry's Hidden Alpha service, we share our favorite large-cap, safe stock that still has the opportunity for big gains.
In the most recent issue of Hidden Alpha, we're putting money to work in one of the defense contractors that supports the U.S. military's supremacy. And due to the market's mispricing, the stock is primed for big upside ahead.
To learn more about this recommendation and gain instant access to Hidden Alpha and the full portfolio of open recommendations, click here.
Regards,
Joel Litman
September 9, 2021