 Everywhere you look, investments are going up...
The market started the year hot. The S&P 500 Index was up 3% at the beginning of March. The tech-heavy Nasdaq Composite Index is up roughly 8% year to date.
Even cryptocurrencies have been racing higher again – bitcoin (BTC) prices have risen 23% year to date.
Longtime subscribers know that when talking about the markets, we like to invoke the phrase, "History doesn't repeat itself, but it often rhymes."
By that, we mean that even when we're dealing with so-called "unprecedented market conditions," lessons from economic history can orient us.
That's why as early as last summer, we've been comparing today's economy to post-World War II America. The year 1945 was marked by a spike in inflation... negative "real" gross domestic product growth... and booming employment.
That's a lot like what we saw last year. And we still think there are a lot of parallels to draw between post-WWII America and our current economy.
But lately, it almost feels like the market is as hot as it was before 2022. Many folks are wondering if the worst of the downswing is already behind us.
So today, we'll look to more recent history to understand what's going on. As we'll explain, two key pieces of data can tell us if these are the early signs of a new bull market... or just a head fake in the midst of a sideways market.
 Investors turned very bullish to start the year...
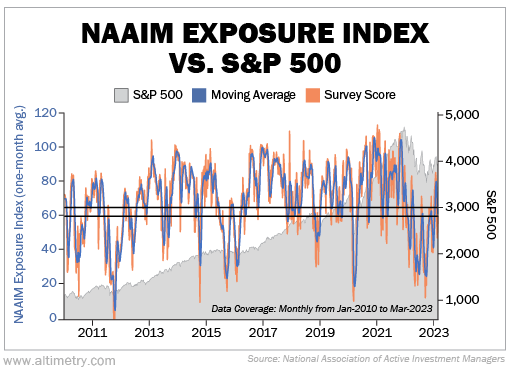
We can see this through the National Association of Active Investment Managers ("NAAIM") Exposure Index.
The index gets its data from a weekly survey that tracks how much members are investing in equities. Results tend to fall between 0% and 100%. But they can be lower or higher than that if investors are shorting stocks or using leverage.
The long-term average allocation is between 60% and 65%. That means in an average market, active investors have 60% to 65% of their assets in stocks.
When allocations rise, investors are bullish. They're pouring a lot of money into the stock market. As you can see in the following chart, allocations peaked above 80% in February.
Historically, above-average allocations have led to rallies in the S&P 500. And on the flip side, below-average allocations – like we saw in March 2020, late 2018, and most of last year – led to market dips.
Take a look...
At first glance, this looks like a good sign. It seemed like investors were seeing the light at the end of the tunnel for this challenging market. With so much discussion of a "soft landing" or a "Goldilocks market" in January and early February, the optimism was palpable.
This chart alone can mean we're kicking off a bull market. But we have to remember that we're in the midst of a bear market today. So it can also mean that everyone has a dramatic fear of missing out ("FOMO")... leading to false signs of optimism.
 That's why the NAAIM chart isn't enough by itself...
To figure out which environment we're in, we have to look at stock market correlations.
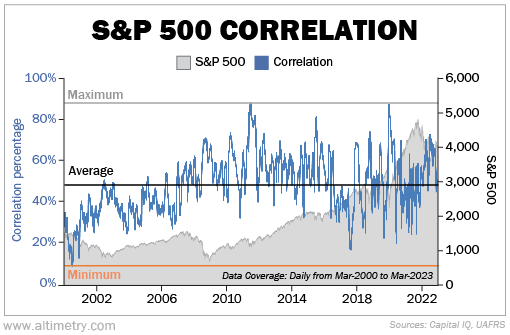
Correlation measures how different stocks perform against one another and the overall market. If all stocks move in the same direction every day, that's a perfect 100% correlation.
Emotion rules in bear market rallies. All investors act together, and they tend to have a quicker trigger.
Practically speaking, that means that if investors see the market rallying, they all pour money into stocks at the same time. If they see the market collapsing, they all rush for the exits. We tend to see high correlations when the market is acting emotionally.
On the other hand, in bull market rallies, good companies tend to get rewarded while bad companies are punished. Individual company fundamentals drive stock performance. That translates to lower correlations.
In March 2020, correlation levels peaked above 87% as the market tanked. Investors were selling everything.
Conversely, during a healthy bull market, correlation levels drop. During much of the 2020 and 2021 rally, correlations sat below their long-term average of 50%.
Like allocations, correlation levels were high in February. Take a look...
Although the market is rallying, it's more emotionally driven than it is fundamentally driven. Everything was rising together... regardless of quality.
It seems like investors got the idea quickly. After allocations peaked above 80% in early February, they snapped back to about 60% this month. That's the low end of average.
This is a sign that the recent rally probably isn't the start of a new bull run. We still think we're in a sideways market.
The recent leg down is nothing more than the natural sell-off after all that emotional buying. So don't be surprised if stocks trend back toward the lower end of this range over the next few months.
Regards,
Rob Spivey
March 13, 2023


 Everywhere you look, investments are going up...


