There's a website that many institutional investors follow religiously...
It has some of the most valuable information Wall Street professionals can access. It's so powerful that it can change how these folks view the entire market.
They just don't talk about it.
This website looks like it hasn't been updated since Web 1.0. It doesn't offer any primary research. And it certainly doesn't run highly advanced audio analysis on management's communication, like our Earnings Call Forensics work.
It's not exclusive to Wall Street, either. You can access it just as easily as a hedge-fund manager with a seven-figure salary.
And yet, this old, obscure website is one of the best ways for institutional investors – and anyone else who knows about it – to learn what management is really thinking.
We're talking about secform4.com.
It's a simple setup. All it does is compile a document that companies file hundreds of times each week, in an easy-to-digest format.
But institutional investors find it invaluable because they understand a key tenet of investing... Whenever you want to understand what management is thinking, the best trick is to follow the money.
Longtime readers know that, in our view, the most valuable annual filing from all public companies isn't the 10-K. It's a proxy filing called the DEF 14A.
The DEF 14A explains how management is compensated. It's central to our incentives dictate behavior ("IDB") research, which helps us understand if management really has our back as investors.
The Form 4 gives us another window into management's thinking. Unlike the DEF 14A, it doesn't tell us whether or not management is focused on the right metrics. Instead, it tells us if the team is confident it can execute... to do what's necessary to push the stock higher.
Any time an insider buys or sells stock in their company, the U.S. Securities and Exchange Commission ("SEC") requires it to be reported in a Form 4. And whenever a company reports a Form 4, it gets posted on secform4.com.
The secform4.com website helps give investors transparency. They know if management is unloading stock or scrambling to buy more. And it might signal that management knows something investors don't.
The website isn't just useful for individual companies, either. It's also a powerful tool we can use to understand the outlook for management teams across the economy.
Today, we will explain how investors can use this insider data to better time buying and selling opportunities in the market.
The website not only compiles filings, it also analyzes the results...
The conclusions of these analyses are not surprising most of the time. As a whole, management teams tend to buy stock when it is cheap and sell stock when it is expensive.
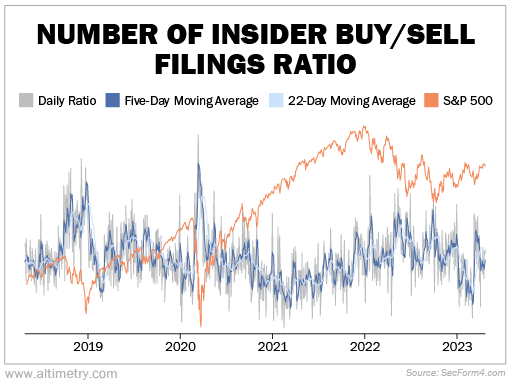
The following chart shows the ratio of daily buy and sell filings from public Form 4 data. A higher ratio means management teams are buying more (and are generally more bullish), and a lower ratio means they are selling more (and are more bearish).
As you can see, the S&P 500 Index sank in early 2020... and insider buying skyrocketed. Management teams knew their stocks were cheap and capitalized on that buying opportunity.
For the most part, the daily ratio (marked in gray above) moves as expected... It rises when the market dips, and it falls when the market soars. The same is true for the five- and 22-day moving averages, marked in dark blue and light blue, respectively. (Those averages measure insider buying and selling over longer periods to help us see past outlier days.)
But every once in a while, something changes... Stocks start dropping, but management isn't buying anymore. Or stocks keep rocketing higher, while management is still buying aggressively.
When management buys even though stocks are soaring, you can hear the sound of a slot machine jackpot going off. The getting is so good that these folks want more stock, no matter the price.
When management is not interested in buying shares on the cheap, it is a flashing warning sign. It signals that management teams across all industries are not comfortable with the macro outlook.
Even though the market is dropping, they would prefer to wait and see. They do not want to risk lighting more of their money on fire.
That is exactly what we saw in mid-March.
The daily ratio of insider buy and sell filings fell close to its lowest level in the past five years... and it got there in a hurry.
Silvergate Capital (SI), Silicon Valley Bank, and Signature Bank (SBNY) collapsed, taking the market down with them.
However, right after that drop, things changed quickly.
The five- and 22-day moving averages rose quickly as management teams took advantage of the market panic, buying up shares as fast as they could.
The daily ratio jumped from near-bottom to slightly above-average levels in only a week.
These aren't the usual market conditions...
Simply put, management teams saw an opportunity, and they capitalized on it.
However, this does not change the overall trend in insider buying and selling... As the market leaves the banking crisis behind, these transactions are bouncing back to pre-March levels.
As a result, both moving averages are falling almost as fast as they rose. That means management teams understand that the buying opportunity was short-lived, and they’re returning to a more cautious outlook.
With today's lower insider buy and sell filings ratio, management teams are much less bullish... In fact, insider buying has plummeted.
It's clear that management teams see the mounting headwinds. As a result, the market volatility that spiked in March and April may continue...
Expect more of the same for the next few months.
Regards,
Rob Spivey
May 1, 2023