It's hard to stop the unemployment 'feedback loop' once it gets going...
Workers get laid off... they spend less money... companies make less money... and they lay off more workers.
Folks, 10 months ago, we warned you that unemployment would be a must-watch indicator in 2024. We've been watching the "Sahm Rule," which tracks the three-month rolling average unemployment rate.
If that rolling average climbs 0.5 percentage points above its one-year low, it's a sign that a downturn has started.
The Sahm Rule has correctly predicted every recession since 1949. And in August, it triggered again. Unemployment rose to 4.3% in July... raising the three-month rolling average to 0.53 percentage points.
That might seem like an immediate red flag. If history is any indication, it's possible we're already in a recession.
But it's important to look at the big picture. As we'll discuss today, we have to consider a lot more than one data point to know where the economy is headed...
Claudia Sahm herself would be the first to remind you of this...
Sahm wrote an article for Bloomberg in early August, titled "My Recession Rule Was Meant to Be Broken." She explained that there are two drivers of unemployment... layoffs and the size of the labor force.
Companies have less demand for labor during recessions. That's a given. But Sahm pointed out that today's surging unemployment rate also has to do with an excess of new laborers.
Last year was America's busiest for immigration ever. A lot more people are entering the workforce.
We can also track if unemployment is the "good" kind or the "bad" kind by looking at weekly initial claims. This is the number of unemployment claims filed by recently laid-off workers.
The same week the Sahm Rule triggered, initial jobless claims came in lower than expected... meaning it might not be as bad as things initially look.
You can't hang your entire portfolio on any single recession indicator – or any economic indicator in general...
Every indicator is right every time... until the one time it isn't. So you have to look at them as part of a bigger mosaic.
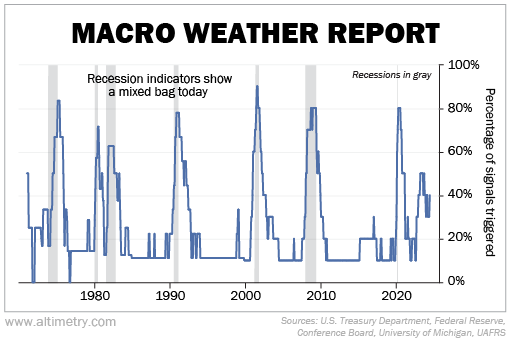
That's the approach we take with our "Macro Weather Report," which we create for one of our institutional clients. They look to run portfolios that make big moves during a recession.
We actually repackaged a lot of our Timetable Investor research for the Weather Report. We look at 10 of the most reliable leading and confirming recession indicators out there.
When more than half of the indicators are triggered, it tends to mean the economy is about to be in a recession... or is already in one.
Take a look...
Right now, a handful of indicators are flashing "recession." That includes both of the yield curves we follow, as well as leading economic indicators... a popular set of metrics that track the economy.
And of course, there's the Sahm Rule.
But we also follow a lot of other key indicators – like consumer expectations, corporate fundamentals, and loan origination data – that say we're not close to the edge.
Some of them aren't just 'not bad'... they're downright healthy.
That's particularly true for corporate metrics like earnings growth, industrial production, and capacity utilization.
When you look at a broader picture, the data is certainly not great. But as investors, it's important to remember that we're investing in corporations... not the economy as a whole.
The latest unemployment data was the first real warning shot across the bow.
The Federal Reserve needs to be careful. If it doesn't start cutting interest rates soon, it will be too late. And it will need to be extremely responsive to keep the economy under control over the next several quarters.
For now, the Weather Report is a bit murky. If we see any storms on the horizon, we'll be sure to let you know.
Regards,
Rob Spivey
September 10, 2024