Dear reader,
Most investors are familiar with Benjamin Graham...
The "father of value investing" wrote the legendary 1949 tome, The Intelligent Investor, and introduced the concept of "Mr. Market."
In Graham's book, Mr. Market is your capricious business partner who owns half of your imaginary company. Some days, Mr. Market will come to you with an offer to buy out the business for half of its value, and some days he will come to you with an offer for twice its worth.
In the financial markets, traders tend to move as groups. Human beings are social creatures, and we instinctively seek the protection in being part of a group. An example of this today is traders acting with popular sentiment when purchasing stocks. Thousands of years of evolutionary conditioning create what is called the "herd mentality."
Graham stresses throughout The Intelligent Investor that rational investors must ignore Mr. Market's day-to-day offers as signals for a company's value. This is why in value investing, investors focus on a business' operations rather than the stock price.
Warren Buffett, Graham's most famous student, has often talked on the value of heeding this advice. He even went so far as to say The Intelligent Investor is "by far the best book on investing ever written." Buffett summed up the folly of Mr. Market by saying, "The stock market is a device for transferring money from the impatient to the patient."
While herd mentality is a fascinating topic in behavioral finance, it has direct impact on explaining the performance of the market. Traders tend to act as a single group when making investments... They follow and create trends. These trends are the underlying drivers of large and small market cycles.
So how can we avoid following in Mr. Market's footsteps?
Over shorter periods of time, we study market sentiment. It can help us see how the market is "feeling" and prevent us from being swayed by the fear and greed rampant on Wall Street.
As we talked about in a previous essay about the yield curve inversion, we anticipate that the next few months could see a sideways market – which has held true so far. In an environment like this, the question we receive most often is, "When is the bottom so we can get back in?"
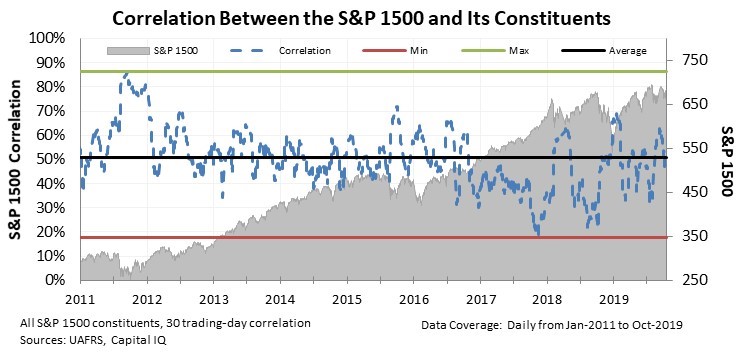
The first measure we use to understand market sentiment is correlation. By comparing how the constituent stocks in the S&P 1500 (a broad market index) move alongside the S&P 1500 Index itself, we can see how much of each stock's movement is currently being explained by the moves of the overall market.
When traders are panicked, they sell everything at once. This means correlations are high... The market is moving as one.
When traders are bullish and are trying to pick individual stocks, many companies will move independent of the broad market. Individual winners and losers will emerge... Correlations will be low.
Right now, the market is near average levels for correlation between the S&P 1500 and its constituents. Traders are not overly bearish and are not overly bullish.
More important, they also never became overly panicked during the latest sell-off in August and again this month. That's as important as where trader sentiment is now. It tells us there never was capitulation.
The literal definition of "capitulation" is surrendering to an opponent. In the stock market, capitulation is a surrender to Mr. Market. In other words, this is when traders give up and panic sell during a market downturn.
While hard to spot in the moment, capitulation is the first sign of a market turnaround. When Mr. Market is telling the world to sell, equities become oversold. Sentiment "washes out," and the market can find a bottom. This is why Mr. Market can be so misleading... Right when you feel the pressure to sell the most, you should be buying instead.
When correlation levels reach very high levels – generally above 65% to 70% – that means almost the entire market is moving together. In this latest sell-off, we never quite got there. Correlation levels peaked around 60%. We haven't seen Mr. Market wash out.
Until we do, we can't confidently predict when the market will break back out.
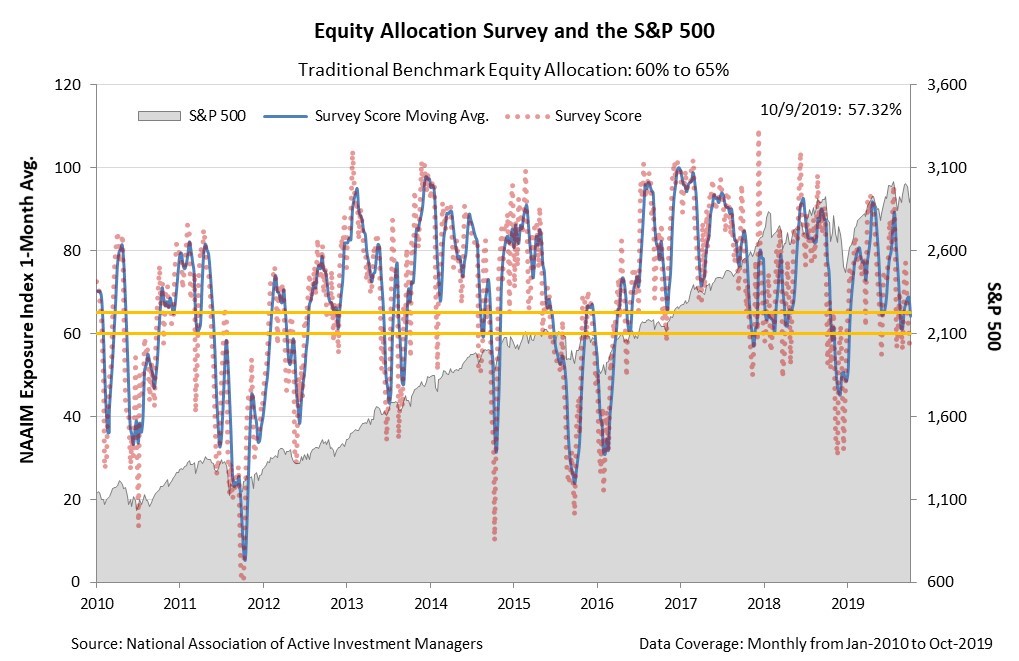
We look at another metric, along with correlation, to understand market sentiment. We look at the amount of stocks investors own in their portfolios. By measuring if investors are moving from stocks to bonds, cash, or other investments, we can similarly see how Mr. Market is "feeling."
Similar to what we saw for correlation levels, stock ownership is at average levels. Investors aren't yet panicked. Also, similar to correlation, stock ownership levels never fell to capitulatory levels in this latest sell-off. They only ever fell to average levels since 2010.
These two metrics, along with the fundamental data we've talked about previously, tell a story of a market that will continue to move sideways. Without high levels of correlation indicating capitulation, we will still see volatility. Similarly, without equity allocation – or stock ownership – falling to low levels in the current environment, we won't see traders wash out and the market reset to move higher.
While credit markets are still strong – indicating a recession won't come knocking tomorrow – look out for continued volatility as Mr. Market does what he does best.
Regards,
Joel Litman
October 28, 2019