Housing is booming right now.
New single-family home prices are up 3% since July 2018. New home sales were up 4.3% in July compared with the same month last year. Year-to-date home sales are up 4.1% relative to the same time last year... and 2018 was a stronger year than 2017.
And yet, investors aren't buying the boom...
Since the beginning of 2018, the S&P 500 Index is up about 10%, the SPDR S&P Homebuilders Fund (XHB) is down 5%. XHB holds shares of about three dozen companies that either build or help folks outfit their homes.
Today, markets appear to fear a recession in housing. The last time we were in the late stages of a bull market, housing got crushed. And investors don't forget that easily...
The "last time" started in 2006, when new-home sales fell 18%. Even though prices were still rising, the writing was on the wall. By 2008 prices had dropped at a greater rate than any other time since tracking that data started.
After a period of too-easy credit for homebuyers, weak underwriting standards, and an assumption that "real estate prices always go up," the collapse that followed was arguably the worst economic crisis since the Great Depression.
XHB was falling in 2006 and 2007, ahead of the last housing crisis... And by the time 2008 rolled around, shares had already collapsed more than 50% from its peak in early 2006.
Last time, housing was a leading indicator for the whole market.
History does not repeat itself, but it does rhyme. It looks reasonable that investors are spooked today.
According to CNBC, "confidence matters more than mortgage rates in housing, and confidence just took a hit." Meanwhile, Fox Business reports at least 40 U.S. cities are in danger of a housing crash this year... and singled out Hartford, Bridgeport, Baltimore, Detroit, and Newark. And another article from financial blog Wolf Street suggests a second housing bubble in the San Francisco Bay Area and Silicon Valley has already popped.
At first glance, there are reasons to question the bear thesis...
Take homebuilder KB Home (KBH). The company saw a strong 2018, with revenues up 4%, earnings before interest, tax, depreciation, and amortization ("EBITDA") up 26%, and normalized net income up 31% over the prior year.
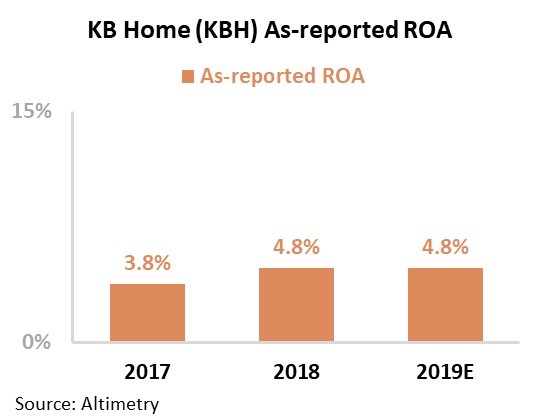
As-reported return on assets ("ROA") was also up in 2018 and is estimated to stay level this year. In fact, the company estimates EBITDA will jump more than 20% next year, continuing trends seen in 2018.
KBH has had strong fundamentals... And yet the stock is down more than 10% since the beginning of 2018. It has underperformed the entire homebuilding sector – and the broader market – by more than double in the same timeframe.
The answer is simple... The as-reported numbers, as usual, are wrong.
The as-reported numbers distort corporate profitability through poor standards related to cash, goodwill, and stock options. These distortions not only affect how we think about company profitability levels but can alter how we view overall trends for individual companies. Sometimes investors catch it... but they usually don't.
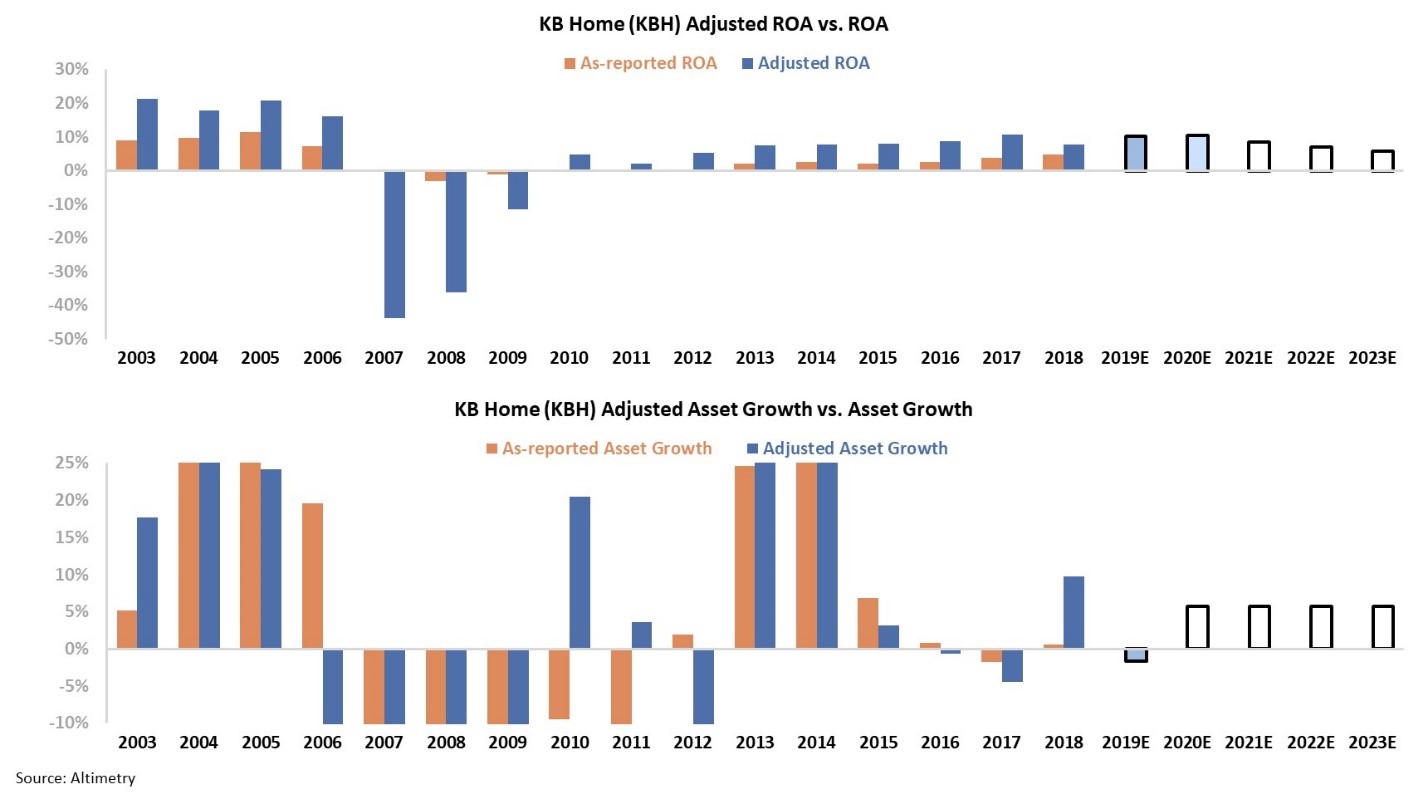
When we apply our Uniform Accounting Framework, which removes these distortions, we can see that this company is actually getting worse. Take a look...
The two panels explain the company's historical corporate performance levels, in terms of ROA and asset growth (dark blue bars) versus what sell-side analysts think the company is going to do over the next two years (light blue bars) and what the market is pricing in at current valuations (white bars).
At KBH's current adjusted price-to-earnings (P/E) ratio of 11, the market is pricing in expectations for KBH's ROA to keep falling. It already fell in 2018 from 11% to 8%... and falling to 6% from today's level isn't much of a stretch, especially if we're in the late innings of this market cycle.
This is what investors are missing when using as-reported financials. When you pick the wrong stocks at this stage of the cycle, it could come back to haunt you.
Regards,
Joel Litman
September 12, 2019