Among all the savvy subscribers who write to us, Anthony H. from New York City really stood out...
We heard from Anthony twice last week. He asked some of the most detailed questions we've ever received from an Altimetry reader.
We can tell Anthony has done his homework since signing up... His excellent list of questions was as long as a typical edition of Altimetry Daily Authority (maybe even two). It spanned a lot of our favorite Uniform Accounting metrics, like return on assets ("ROA") and earnings.
However, the majority of his questions focused on our Embedded Expectations Analysis ("EEA") framework.
We've welcomed a lot of new subscribers since the start of the year. And we're sure Anthony isn't the only one looking to learn more. So this week, we're taking a break from our usual fare... for a three-part "refresher course" on how we find and analyze misunderstood stocks.
In part one, we'll cover the basics of the EEA framework – using one of New York City's most iconic burger chains...
Engaged Capital doesn't invest in companies and wait for shares to rise...
Instead, it works with those companies to improve their businesses, unlocking the stock's value faster.
Just last week, the hedge fund announced an activist stake in beloved burger chain Shake Shack (SHAK). It's pushing Shake Shack to improve its digital presence and cut costs.
This particular example came to mind because Glenn Welling, the founder and chief investment officer of Engaged, is a former colleague and friend from my Credit Suisse days.
Back then, he was leading the Buy-side Insights Group ("BIG"). This was a special group that used cleaned-up accounting analytics... just like we do at Altimetry.
Credit Suisse used BIG's insights to help its bankers sell deals and to consult corporate clients. One of its flagship tools allowed public companies to compare their historical financial performance against market expectations.
This was a useful way to understand if the market was feeling bearish, bullish, or neutral about the company's outlook.
If you've been with us for a while, BIG's analysis may sound familiar...
It's a lot like our EEA framework. We're all but certain Glenn and the Engaged team looked at this type of analysis when they jumped in to Shake Shack.
So we're going to do our own EEA for the same stock...
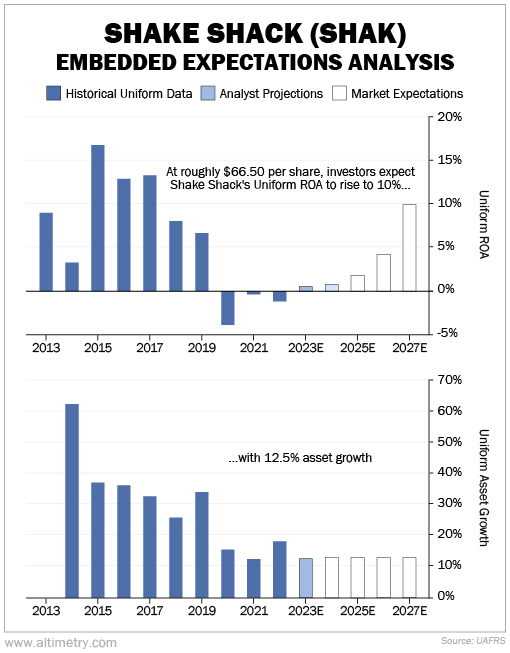
The EEA consists of two charts. The first shows Shake Shack's Uniform ROA. Think of this as its profitability. This is the chart we normally feature in Altimetry Daily Authority.
The second chart shows asset growth. This measures how much the company grew or shrank its asset base year over year. We include this chart in our monthly advisories.
Each chart has three different sets of bars. The dark-blue bars are historical numbers. That's what actually happened over the past 10 years, through the lens of Uniform Accounting.
The light-blue bars are Wall Street analyst forecasts for profitability and growth over the next two years. This is the most likely outcome for a company's expected performance in that time frame.
Finally, the white bars are what we call "market expectations." These bars show what investors predict for the company's future... based on its current stock price. The numbers fluctuate based on stock-price fluctuations. (More on this shortly.)
Take a look at Shake Shack's EEA the day before Engaged announced its activist campaign...
Anthony asked two "big picture" questions about the EEA framework. He wanted to know how we calculate the market expectations portion... and our goal in doing so.
We start by looking at the company's stock price. For the above charts, that's roughly $66.50 per share (as of the day before Engaged announced its activist campaign). That number tells us what the market expects from the company's future performance.
We then flip that information around... We calculate how the company will have to perform in order to meet investor expectations.
In Shake Shack's case, it needs to generate a 10% Uniform ROA with 12.5% Uniform asset growth per year to be fairly valued (worth $66.50 per share).
We like to say the EEA is a discounted cash flow ('DCF') model turned on its head...
Most Wall Street analysts use the DCF model. They add up their projections for all future cash flows... and discount them based on the "cost of capital." That just means how much money a company will have to spend to generate those cash flows.
That's how normal DCFs work. They're built on analyst assumptions.
There are a lot of investors combing over companies' earnings. For most companies... the market gets it right.
(That's why we don't recommend 1,000 companies here at Altimetry. Big-upside opportunities don't grow on trees.)
With our EEA framework, instead of coming up with our own assumptions, we start by assuming the market knows best. We use Uniform ROA and Uniform asset growth because they're an easy way to model free cash flow.
In 2022, Shake Shack had $842 million in Uniform assets. Since its ROA was negative last year, it didn't generate any real earnings.
Investors are betting the company will generate a 10% Uniform ROA in 2027. They think Shake Shack will have grown by 80% (12.5% per year for five years).
So the market expects Shake Shack to have $1.5 billion in assets... and to have generated roughly $150 million in free cash flow. That's what the company must achieve in order to match up with investors' projections by 2027.
And our own expectations – based on even further company analysis – can tell us if investors are undervaluing or overvaluing the stock.
Tomorrow, we'll dig deeper into how we can figure out if the market is wrong... again using Uniform ROA and asset growth.
In the meantime, the market expects quite a reversal based on Shake Shack's recent performance. Any disappointing news could send investors running for the exits.
Regards,
Joel Litman
May 23, 2023