It's earnings season... and everyone wants to know the implications for the market.
After the impressive rally over the past several weeks, you might not be aware that we're no longer in a bear market. The benchmark S&P 500 Index is down roughly 15% from its all-time high on February 19. And now, we're entering the heart of earnings season...
The first quarter (Q1) is likely to be challenging for most companies. Many businesses have been particularly affected in the back two weeks of the quarter... And for others, significantly more of the quarter was disrupted by the coronavirus pandemic.
And the second quarter (Q2) is likely to be even worse as the effects of the coronavirus continue to sweep through the economy. We can expect to see a lot more write-offs and impairments in Q2, as accountants roll up their sleeves on goodwill valuations and as management teams look to build reserves for restructuring. This will be especially true if the disruptions extend longer than currently anticipated.
But all those observations are qualitative. Can we look at real numbers to understand if the market is overreacting, or if things are worse than analysts and investors are anticipating?
As a matter of fact, we can.
Currently, operating earnings per share ("EPS") for the S&P 500 in Q1 this year are forecast to be $32.62, and the as-reported EPS (before special items are removed) forecast is $28.82. Both those numbers point to earnings down 15% to 20% from Q1 2019 levels.
All of a sudden, the market being down 15% makes sense, right?
Well... not exactly, for both good and bad reasons.
Again, Q2 is expected to be much worse than Q1 – earnings are forecast to be down 23% to 25% from the same period last year. If that's the case, shouldn't the market be down more?
No... because by the fourth quarter of 2020, earnings are currently forecast to exceed levels from the same period last year. This indicates that the earnings hit could be short-lived.
The next obvious question might be whether or not those numbers will be accurate. Couldn't companies disappoint on those estimates, meaning things are worse than reality?
It's certainly possible. Keep in mind that right now, we're very early in the earnings season. Less than 10% of companies have reported numbers, and many of those have been financial businesses.
But so far, the signs are good. In an average quarter, roughly 70% of companies beat the estimates analysts had for earnings before the company reported, 21% miss estimates, and 9% meet estimates.
So far this quarter, 71% of companies have beaten estimates. The breakdown of misses and beats isn't as favorable, though. We're a bit ahead on misses, with 27% missing earnings estimates and only 2% having met estimates exactly. That being said, this isn't wildly different from a normal quarter.
If analysts do have a decent handle on corporate reality, once we get through an ugly Q2 season, we should start to see a recovery in fundamentals and real reasons to see a recovery in the stock market. Of course, we're early in Q1, so we're not sounding an "all clear" yet... But it's important to remember that there's often data out there to answer the questions that are nagging us.
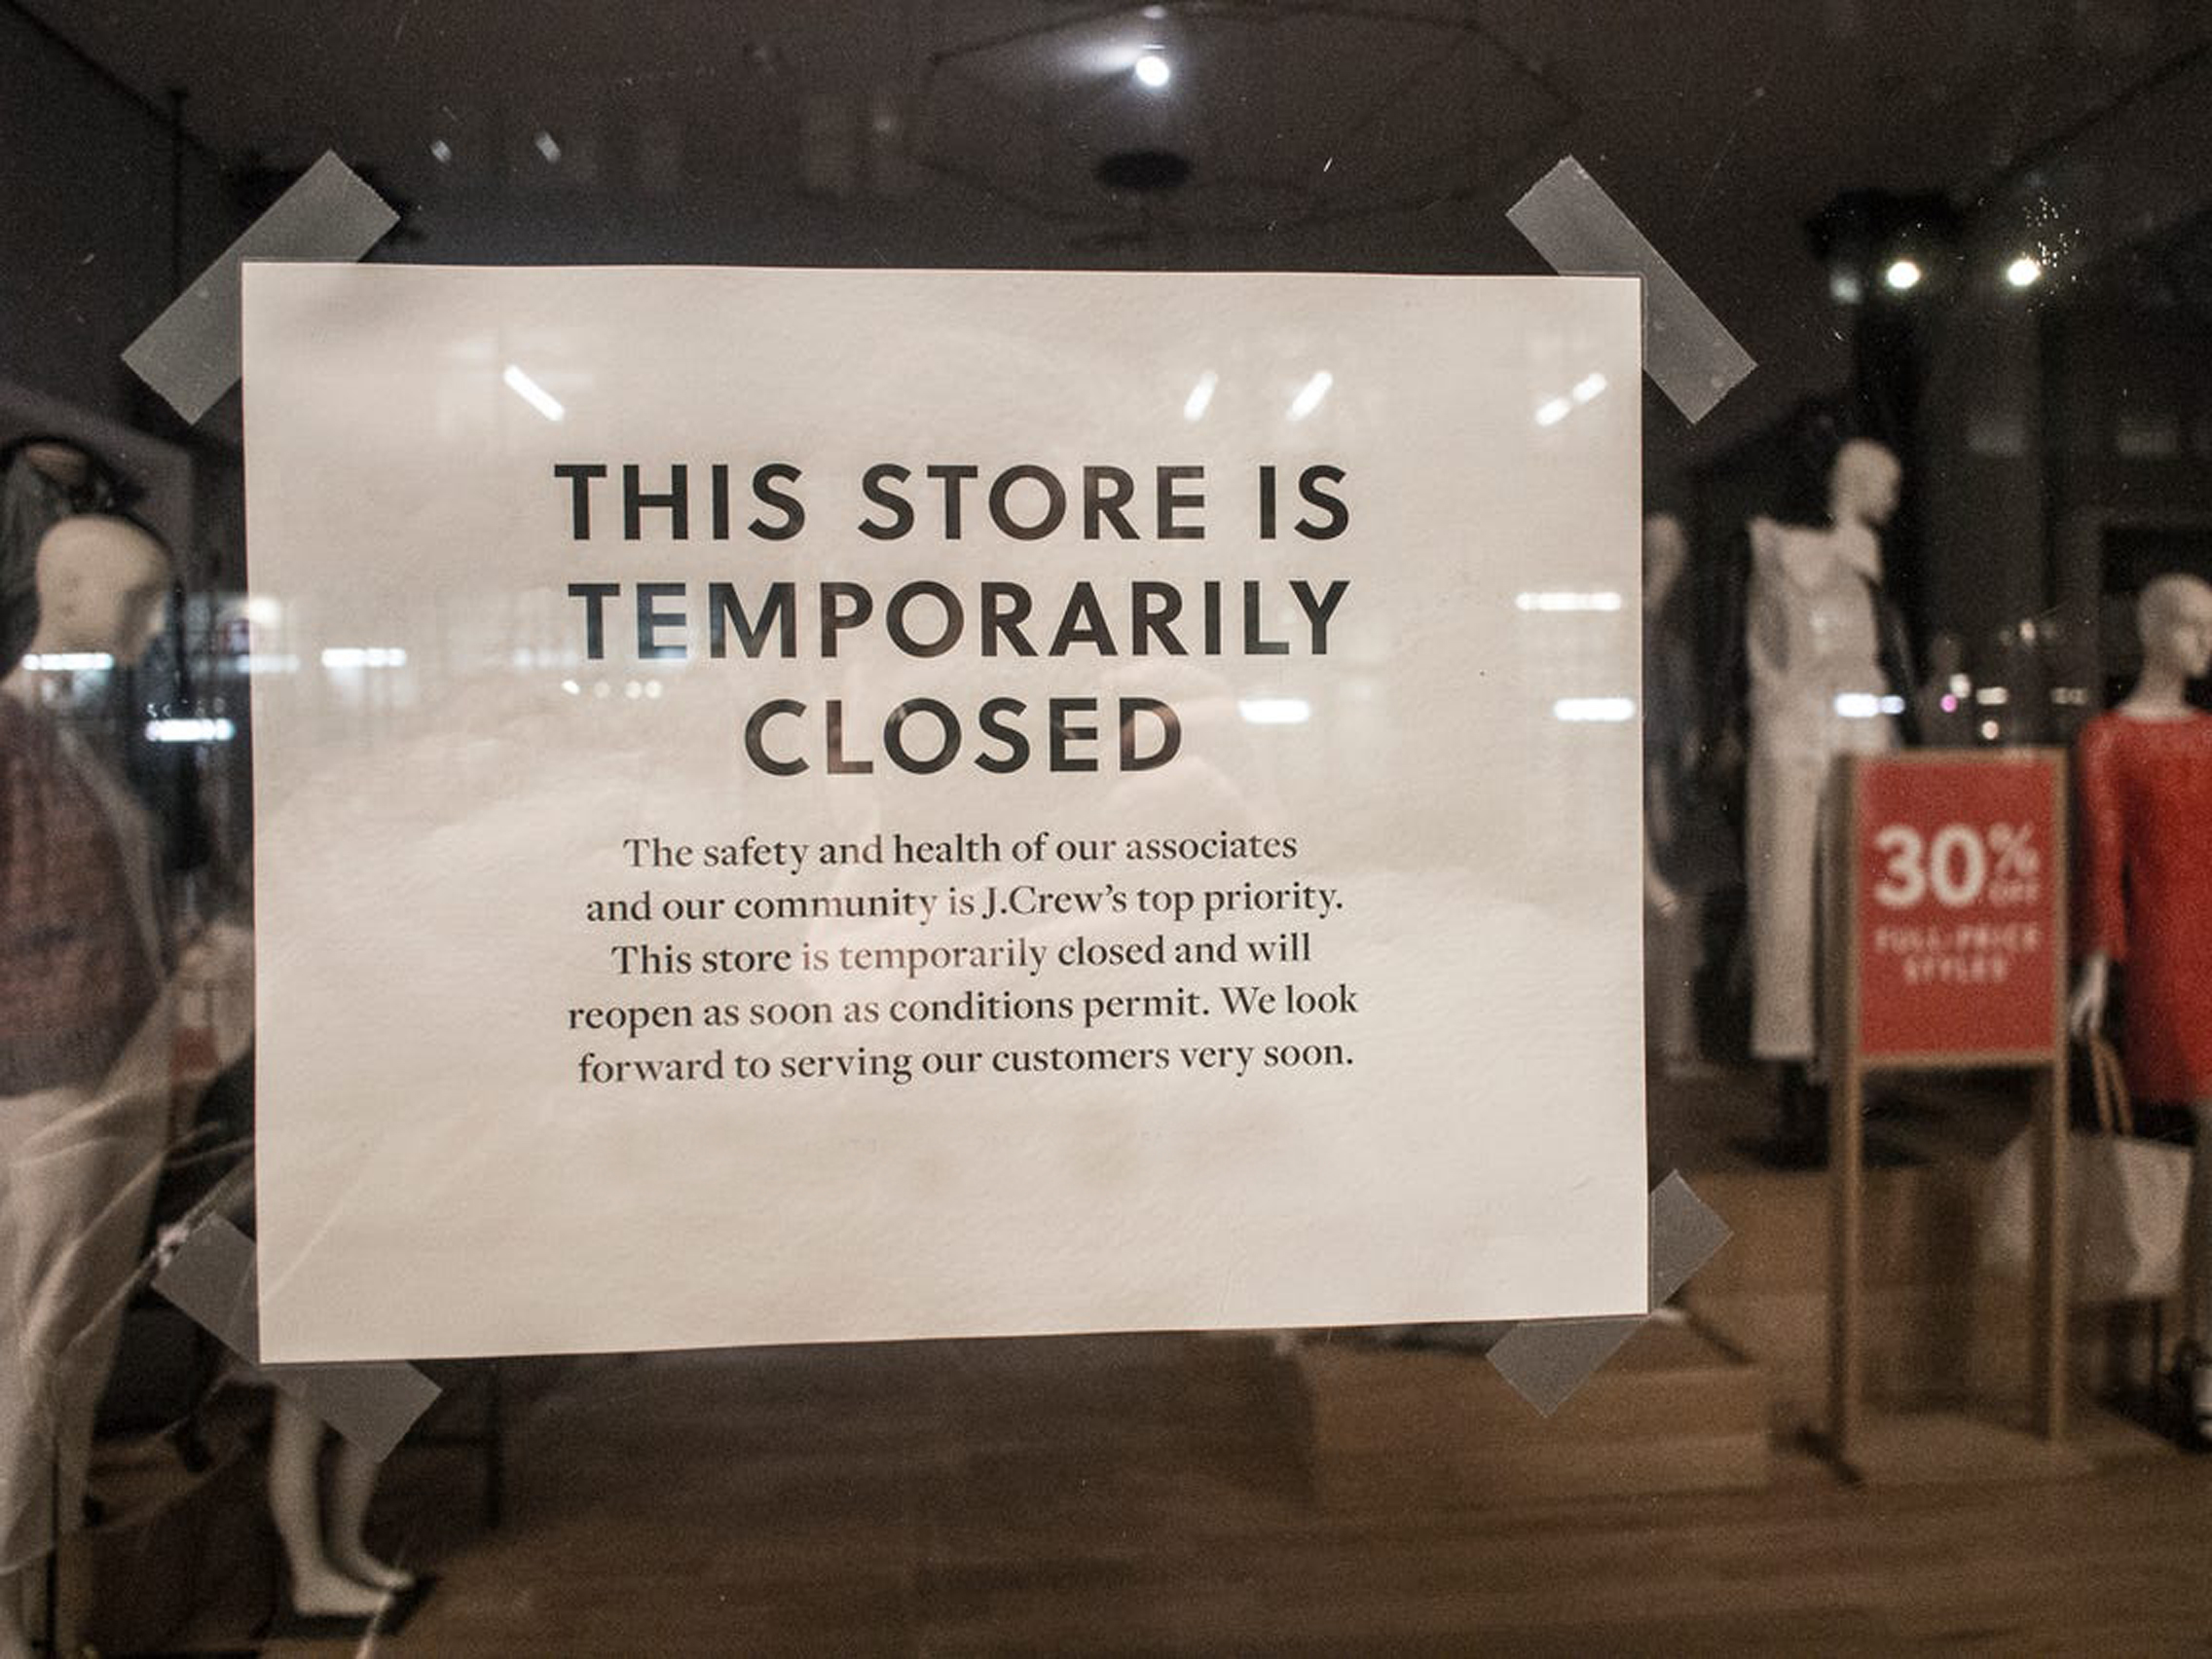
There's no question about it... retail is under pressure.
You've probably received e-mails from some of your favorite stores begging you to buy their merchandise online at steep discounts.
They're doing everything in their power to clear out inventory so they can pay their bills.
Not only is it expensive to have to store those goods in warehouses, but many retailers are still being asked to pay rent even where their stores have been shut down by the government.
Within the past few weeks, many stores have had to decide whether they were going to pay the first month of rent with no revenues coming from physical locations. We're approaching month two in less than 10 days. And many of these stores are getting desperate...
Some retailers are offerings steep discounts to get whatever revenue they can, while others are cutting costs by permanently shuttering brick-and-mortar stores and laying off employees.
Worse yet, many consumers seem to be holding onto more of their money due to the uncertainty. Outside of buying necessities, a lot of people are avoiding spending on items like clothes, artwork, and furniture.
That's exactly why retailers who sell "non-essential" goods are classified as "consumer discretionary."
During down years, the consumer discretionary sector gets hurt worse than consumer staples. On the flipside, it tends to perform better as the market recovers.
And this is a unique period where we could see the consumer discretionary sector change substantially...
The coronavirus pandemic has forced many businesses to grow their online presence more than ever before, and that could easily become the new normal.
The companies who were ahead of the curve and have been focusing on Internet retail for years may have a leg up as the market rebounds.
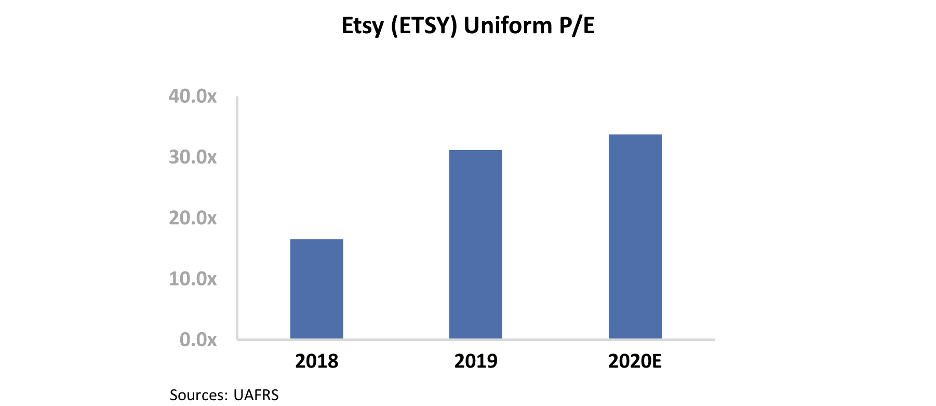
This even includes "retailers" who are exclusively online, like the homemade-craft business Etsy (ETSY). Despite the fact that the company has no physical stores, its stock struggled significantly... dropping as much as 49% during the peak of the crisis last month.
The market seems to recognize it may have overreacted, as Etsy's stock price and Uniform price-to-earnings (P/E) ratio have both recovered to pre-coronavirus levels. Though Etsy’s Uniform P/E briefly fell to just 24, it has rebounded to 34 times, which is above market averages.
This doesn't appear to be a huge deal, but when you consider what coronavirus could do to Etsy’s long-term demand, current valuations begin looking like a steal...
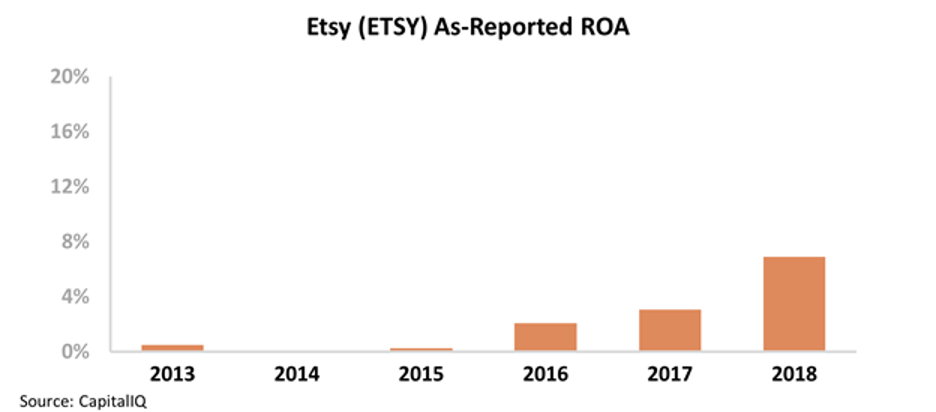
On an as-reported basis, Etsy's profitability has performed well over the last few years. The company has grown its return on assets ("ROA") in each year since 2014, from near 0% to a high of 7%.
However, this doesn't begin to capture the fundamental momentum Etsy has seen over the past few years...
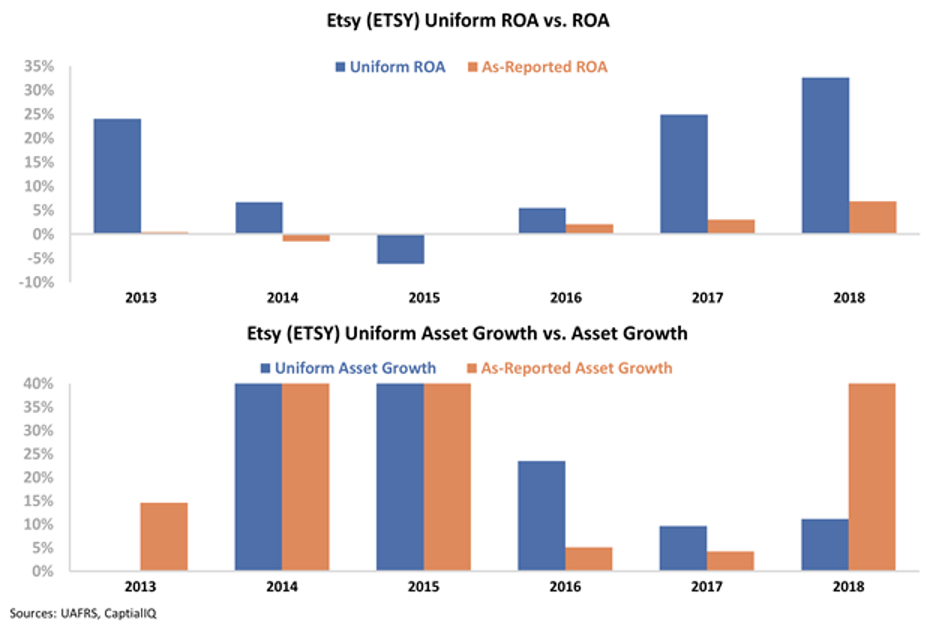
Once we apply our Uniform Accounting metrics – which adjust for misleading accounting standards like the treatment of non-cash stock option expenses, goodwill, and research and development (R&D) – we can see that Etsy has looked like a rocket ship.
As-reported metrics significantly understate just how much Etsy has been able to expand its profitability. While the company's Uniform ROA was negative in 2015, this has since expanded to 33%... and it doesn't appear to be slowing down.
To that point, Etsy has also expanded significantly since 2014. It's grown by an average of 37% annually and by at least 10% in each of the last five years.
The chart below highlights Etsy's Uniform ROA and asset growth since 2013. Take a look...
The market tends to pay higher valuations for companies with strong growth, and Etsy may have more growth opportunities than the market realizes.
There's a chance Etsy sees a few bad quarters, but this represents a great opportunity for the marketplace...
For many laid-off workers, starting a side business on Etsy may be more viable than ever. Furthermore, Etsy has better online infrastructure than many other retailers, which could drive more buyers to the site going forward.
This could be an opportunity to buy a high-growth firm with accelerating returns before valuations start expanding in turn... But you may not realize it if you only look at as-reported financials.
Regards,
Joel Litman
April 21, 2020