Welcome to the latest market bloodbath...
In the past three days or so, more than $1 trillion was wiped off the U.S. market cap.
The S&P 500 Index was down more than 7% from last Wednesday's close to Monday's open. And that's not even the worst of it...
The tech-heavy Nasdaq Composite Index was down more than 10% in the same time frame. At Friday's close, it was 10% off its July 10 highs.
The small-cap Russell 2000 Index got hit even harder. In mid-July, it rallied 11% in just a few days. It erased almost all of those gains from Thursday into Monday morning, falling more than 10% by the open.
Investors and pundits are tripping over themselves to figure out if this is a natural pullback... or the start of something bigger.
And based on one essential economic indicator... they're right to wonder.
The latest worrying signs for the economy started on Thursday...
Along with some key employment data, the Institute for Supply Management ("ISM") released its survey of manufacturing activity... which came in at a multi-month low. Many survey respondents talked about weakening demand.
And it got worse on Friday, when the most important employment datapoints came out.
Investors expected 175,000 jobs created. The actual results missed that by a wide margin, coming in at only 114,000 new jobs. And the number for each of the prior two months was revised down from initial estimates.
That led the unemployment rate to jump from 4.1% to 4.3%.
Any time a key economic indicator misses expectations by that much, investors panic.
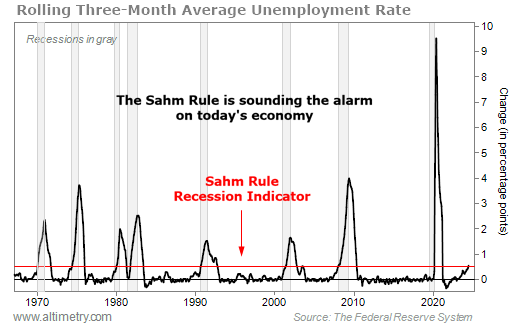
It's not the headline unemployment rate that matters. Our alarm bells are going off because of the way the unemployment rate is changing over time... as measured by the Sahm Rule.
Regular readers know the Sahm Rule tracks the three-month rolling average unemployment rate. If that rolling average climbs 0.5 percentage points above its one-year low, it's a sign that a downturn has started.
Investors track plenty of recession indicators. But the Sahm Rule is special... because it has never given a false positive or a false negative signal.
It also tends to be "coincidental," meaning it usually flashes right in the midst of a recession. That's a lot more useful than indicators like GDP, which only tell you that a recession happened after the fact.
On Friday, the Sahm Rule told investors that we're in a recession...
Weaker-than-expected employment data pushed the three-month rolling average to 0.53 percentage points above the one-year low (the red line).
See for yourself...
As you can see, every time the rolling average climbs this high, the U.S. economy is either already in a recession... or it's about to be in one.
Over the past three months, it has become clear that the Federal Reserve will start cutting interest rates soon. We now expect 75 basis points ("bps") of interest rate cuts, if not more, by the end of the year.
In early July, it looked like September would be the perfect time for rate cuts to start. Inflation was cooling down, but employment metrics were still healthy.
That's why the Russell 2000 exploded higher in the first half of last month. Small companies are the most economically sensitive... And investors were betting on the Fed to thread the economic needle.
Thursday's and Friday's data changes that calculus significantly...
It now seems like the Fed is going to be reacting in September (and for the rest of the year), as opposed to controlling the economic narrative.
Of course, this is only one data point. We have to consider a lot more information to know where the economy is really going – and what it means for the market. Long-term equity investors shouldn't just react to "recession" or "no recession."
But the market's latest moves may not be a blip in the rally. The Sahm Rule tells us this could be the start of something bigger.
Make no mistake... A key alarm bell is ringing. Investors need to tread carefully with today's pullback.
Regards,
Rob Spivey
August 6, 2024