If you believe the headlines, any number of things could trigger the next recession...
Morgan Stanley predicts we will enter a recession within the next nine months due to heightened tariffs from the trade war. Capital Economics says there is a one in three chance the U.S. will be in recession in the next year based on bond market signals. And President Trump has even accused the "fake news media" of trying to cause an economic crisis.
What many investors fail to consider is that although China, international politics, and trade can impact corporate profitability, slowing profits won't start a recession on their own.
What will start a recession? Debtors having to refinance debts at the very moment when they cannot.
That creates a recession and a bear market.
Every major recession of the past 150 years – and really since modern banking emerged in Europe in Italy in the 1100s – has started with a debt crisis.
Worries about China or politics alone are not enough to send the economy and market into recession and bear market territory.
So are we headed toward a debt crisis?
No, not yet anyway. For U.S. corporations, there are no near-term signs of an impending debt crisis.
Companies have two options to service their debt as it comes due.
- They can pay off the debt with their cash balance and cash flows.
- Or, they can refinance their debt with more debt due at a later date.
Debt crises normally begin when companies are unable to refinance their debt. They are still on the hook to pay. But they don't have the cash to do so. And banks aren't willing to lend to them.
However, if corporations have enough cash to pay their upcoming debts, there's no problem. That gives them "runway" to weather any short-term concerns... whether profitability and growth, political instability, trade wars, or anything else.
By looking at all U.S. corporations' debt, cash flows, and cash on hand, we can accurately gauge the overall health and runway of the entire U.S. economy. That lets us know how long we have before debt concerns become warranted.
Using traditional accounting metrics, this wouldn't be possible. The problems with how different companies treat metrics like leases, interest expense, capex, and other metrics would make their accounting incomparable. Any big-picture analysis would be "garbage in, garbage out." But using Uniform Accounting, a more reliable way of looking at companies than the GAAP and IFRS accounting policies, we can see a better macro picture.
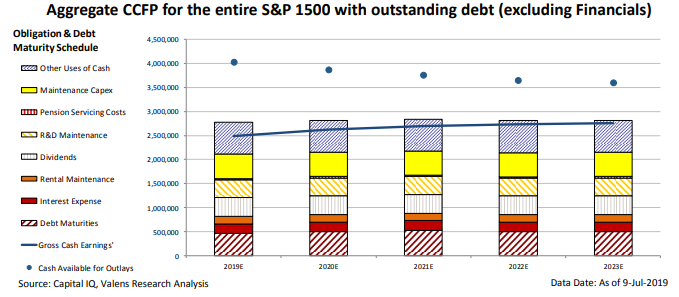
The above chart highlights the aggregate "Credit Cash Flow Prime" chart for the S&P 1500, which represents 90% of the market cap of U.S. stocks (a very good proxy for the U.S. economy). The S&P 1500 is a combination of the S&P 500 (500 largest U.S. stocks) plus the 1,000 next-largest stocks.
The chart has a few important features worth highlighting. The vertical bars represent all financial obligations U.S. companies have after Uniform Accounting adjustments, organized from the most flexible (blue section at the top) to the least flexible (red stripes at the bottom). This "stack" bar includes items like debt maturities, reinvestment into the business, dividends and share buybacks, and rent.
The blue line represents the aggregation of corporate cash flows used for paying their financial obligations, while the blue circles are aggregate cash on hand (added to the cash flow each year). Companies begin getting in trouble when their cash and cash flows no longer exceed the stack.
The chart above highlights that, in total, U.S. corporations can nearly service all their obligations including share buybacks with cash flow alone, and their cash allows a fair amount of buffer should any trade risks or slowing Chinese growth impact their cash flows.
Since the S&P 1500 includes the largest and most successful corporations, it can be somewhat misleading due to large outliers like Apple and Amazon. Therefore, we find it useful to look at a few additional charts to get the full picture.
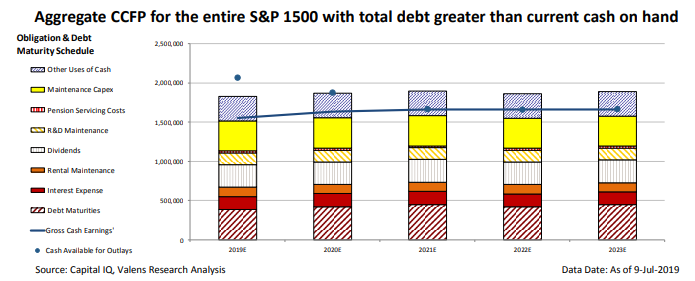
This chart removes any companies with more cash on hand than total debt. In other words, it represents the "riskiest" public companies in the U.S.
Their credit health is noticeably worse. Even still, their cash only drops into "Other Uses of Cash" which represents largely optional payments towards things like share repurchases. Given their flexibility to authorize these payments or not, this still does not represent a major risk in the short term.
In fact, without share buybacks, these companies would have no issues handling all their obligations with cash flow alone, even if none of them refinanced their debt obligations. And yet through the second quarter of 2019, some of those debts have already been refinanced.
Even the riskiest companies in the U.S. have a runway before any debt issues might crop up.
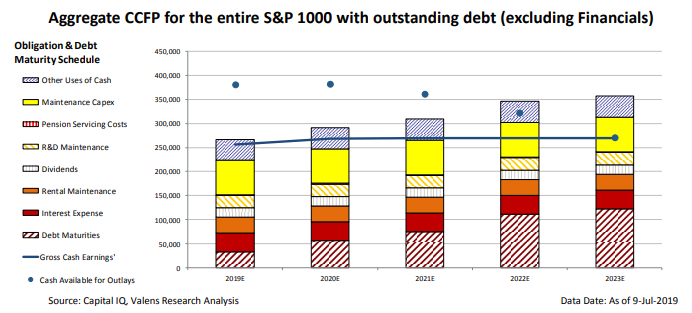
Above is the "S&P 1000," which is the S&P 1500 minus the S&P 500.
At this point, a pattern starts to emerge. Cash levels fall squarely in the middle of Maintenance Capex by 2023, and annual debt maturities have tripled. While this picture is not ideal, it's worth noting that there's still not a real cash crunch until 2022!
That's a three-year runway before debt issues could crop up – the kind that could send the market, and the economy, into a real tailspin.
While headlines and as-reported data can lead an investor in incorrect directions, our Uniform Accounting gives us yet another reason to remain positive on the market for the foreseeable future.
As traders say, buy the dip.
Regards,
Joel Litman
September 9, 2019