It's not just the economic data that should give you confidence about the market...
Over the past two weeks, we've repeatedly highlighted the economic reasons investors shouldn't be concerned about this pullback.
In the face of the Federal Reserve cutting interest rates by 50 basis points yesterday, it's relevant to step back and also look at the social and health factors driving current market volatility and uncertainty. It can help give us context for the potential depth and duration of any disruption.
And as more information comes out about the coronavirus, we're seeing some important insights emerge...
Part of the reason the virus has proven hard to contain is actually a good sign for the risk of the epidemic. Most of the cases for coronavirus are mild. Patients present symptoms no worse than a common cold in roughly 80% of cases thus far.
Also, most of those who have grown particularly ill are generally older adults or people with pre-existing health issues. The disease isn't like Spanish influenza (or even SARS) that could widely disrupt healthier individuals.
On top of that, Spanish influenza is widely viewed to have had a 10% to 20% mortality rate for those who came down with the illness. The SARS mortality rate was 14% to 15%. In confirmed cases, coronavirus is currently trending at around 2%.
And that is a 2% mortality rate in confirmed cases. With many patients presenting only mild symptoms, cases may not be reported if people don't think they have coronavirus... So the real mortality rate may be significantly lower. For context, the flu has roughly a 0.1% mortality rate.
That doesn't mean that you shouldn't be concerned if you develop symptoms... It's still critical to take care of your health. But in the context of your portfolio, it's important to consider the facts.
While words like "epidemic" are always scary to hear, the reality is that the coronavirus is likely not as concerning as CNN, Fox News, and other 24-hour news networks might have you believe. That significantly de-risks a worst-case outcome... even with the disease spreading overall.
It's yet another one of the many reasons we've repeatedly told readers to stay the course in the face of the recent volatility.
Many companies are punished for having a big bank account...
For as important as cash is, it's considered somewhat taboo in corporate America.
As regular Altimetry Daily Authority readers know, we focus on return on assets ("ROA") as a measure of corporate profitability.
We typically do this by comparing all of a company's assets to all of its earnings, but there are ways to go into greater detail...
For instance, with a company like e-commerce giant Amazon (AMZN), it's possible to calculate an ROA for each of its major business segments. This can be helpful for understanding which segments are cash cows (Amazon Web Services) and which are less profitable (retail).
Any good CFO will conduct this level of analysis to understand which company projects are profitable versus which ones are losing money.
This is where the corporate aversion to cash comes from. As long as that cash is sitting on the balance sheet, it's essentially generating a 0% ROA. Cash doesn't earn a return in the current interest rate environment. But once this money is invested into projects, assets, or new businesses, it can start generating a real ROA.
Companies will sometimes deploy that cash into other investments to try to earn a better return – such as bonds, equities, and sometimes into individual company investments. These are considered "non-core" to the business.
We refer to these as "non-operating" investments, since their returns often don't track the profitability of the actual business.
Some companies simply can't spend all of their cash. Tech giant Apple (AAPL) is a great example. The company generates so much money at such high margins from selling iPhones, AirPods, and other hardware that it cannot possibly find enough profitable projects to use up all of its extra cash.
Inherently, companies need some level of cash to keep their businesses running. After that, we consider any leftover money to be "excess cash." One of our major adjustments under Uniform Accounting is to remove excess cash and non-operating assets from the balance sheet, since these don't reflect a company's real profitability.
We instead include those as a separate asset that an investor gets when he buys stock in the business.
For Apple, this makes a huge difference... The company has nearly $70 billion in excess cash and more than $100 billion in non-operating investments.
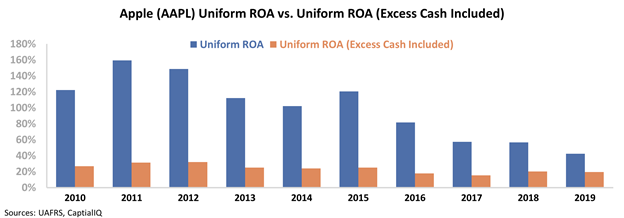
The chart below shows the difference in Apple's Uniform ROA with and without including excess cash and non-operating investments on the balance sheet.
Apple's cash balance and non-core investments alone can cause its ROA to look as much as 5 times smaller than it actually is – and this includes the rest of our adjustments under Uniform Accounting.
And Apple is far from the only company impacted by non-operating, non-productive assets pulling down returns...
DISH Network (DISH) is another great example. While the company is most known for its satellite TV offering, it also owns a large portion of wireless spectrum that currently isn't generating returns. DISH bought the licenses but hasn't built a business to use the spectrum.
Back in 2013, DISH attempted to buy Sprint (S) to enter the wireless provider business. While the attempt was unsuccessful, DISH has continued spending much of its excess cash on wireless spectrum.
At this point, DISH's portfolio of largely unused wireless spectrum is worth nearly $20 billion. The company figured it would be able to enter the wireless provider space or sell the spectrum to another provider, but neither has happened.
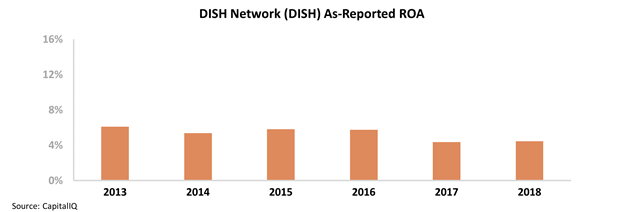
As a result, DISH's returns have fallen in recent years. Since the company's bid for Sprint in 2013, its as-reported ROA has fallen from 6% to just 4%...
However, not all hope is lost... As part of Sprint and T-Mobile's (TMUS) ongoing merger, DISH has agreed to acquire certain assets from both businesses to become another major wireless carrier.
When this happens, DISH will finally be able to monetize all of the wireless assets that are currently collecting dust on its balance sheet.
This may lead returns back to historical levels – a trend you can't see when using the as-reported numbers.
Once we apply our Uniform Accounting metrics, we can see that DISH's historical performance is much stronger than investors realize... and the market isn't pricing this in.
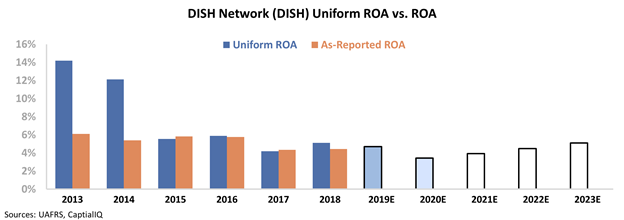
The chart below highlights DISH's historical corporate performance levels in terms of Uniform ROA (dark blue bars) versus what sell-side analysts think the company is going to do for full-year 2019 and this year (light blue bars) and what the market is pricing in at current valuations (white bars)...
As you can see, prior to DISH's massive investments into wireless spectrum that ramped up significantly in 2015, the company's ROA was consistently greater than 10%. Compare this to its as-reported ROA, which has never surpassed 6%.
Investors expect DISH's ROA to expand back to 5% – meaning they misunderstand just how profitable this business can be when the company is properly monetizing its assets.
As DISH finally begins to transition to a wireless provider, its ROA could improve back toward historical levels closer to 10%.
Basically, any return from the $20 billion it invested in spectrum is better than the current 0% return... but the market is still pricing that part of the business as though it will continue to earn nothing.
And as DISH starts to boost returns, that could push valuations higher.
Regards,
Joel Litman
March 4, 2020