Due to massive amounts of stimulus spending and lending, debt has ballooned this year...
And the numbers are staggering. As hedge-fund great Leon Cooperman recently told Bloomberg, the U.S. will likely end the year at a $27 trillion deficit.
Here at Altimetry, this massive increase in leverage hasn't gone unnoticed... As we said back in June, valuations were higher than the markets recognized. Even as stocks were below their highs, increased debt meant that enterprise values ("EVs") were inflated. (EV is just a more comprehensive alternative to looking at market cap, as it includes both debt and cash in its calculation.)
Cooperman also raised another important issue... This debt will need to be refinanced or paid down at some point in the future. Although the U.S. Federal Reserve has taken huge steps to attempt to avoid a debt-driven collapse in 2020, this has created more risk in the long term.
And yet, Cooperman didn't mention the other part of the story – the timing of the potential debt crunch. If it occurs in 2025, that means we have five years for economic policy and corporate changes to occur. Therefore, investors shouldn't be investing against this potential risk right now.
Understanding the term structure of debt is paramount for a debt crisis, because the need for companies to refinance their debt when they can't is the root cause of default. While overall leverage may be a concern, until the debt reaches maturity, the market will first focus on earnings and how the economy is recovering.
One way to get an idea whether the market is worried about a company's impending credit risk is by looking at its credit default swaps ('CDSs')
These act as insurance on the company's bonds, with a larger basis point spread ("bps") indicating a higher risk for the company in question. Any company with a CDS above 600 bps is a high credit risk, and a CDS above 850 bps is considered very high risk. Once the number reaches the thousands, the company is priced for imminent bankruptcy risk.
Back in 2013, retailer J.C. Penney (JCPNQ) had a CDS of 1,241 bps, pricing it for bankruptcy within a year or two at the latest. However, it took more than seven years and a global pandemic to finally force the company into bankruptcy.
Part of the reason the market missed J.C. Penney's credit risk is a misunderstanding of the company's debt maturity structure. The market simply saw the retailer's massive debt load and declining profitability and priced it for bankruptcy.
However, J.C. Penney had more flexibility than many investors thought at the time. Its debt didn't mature for another four to six years, coming due in 2017 and 2019. This gave the company the option to improve operations or refinance its debt over a period of multiple years.
J.C. Penney had a much longer runway... So it was able to survive for much longer than the credit markets expected.
Similarly, satellite communications and broadband company Viasat (VSAT) is currently rated as a high-yield "B2" credit according to ratings agency Moody's (MCO). This indicates a high risk of default. Taking a look at some of the company's debt metrics can help explain why this is...
Viasat's ratio of earnings before interest and taxes ("EBIT") to interest coverage – which measures a company's ability to pay debt – is barely above 1.1 times. Viasat also has a ratio of total debt to earnings before interest, taxes, depreciation, and amortization ("EBITDA") north of 5 times. This measures how much leverage a company has relative to its earnings power.
Both metrics indicate that this is a highly levered company with an elevated credit risk. Viasat has limited cash flows to pay off the large amount of debt it has taken on.
However, when we look at Viasat's Credit Cash Flow Prime ("CCFP"), we see a different story. We can see through the "ratio fallacy" of Viasat's imminent credit risk.
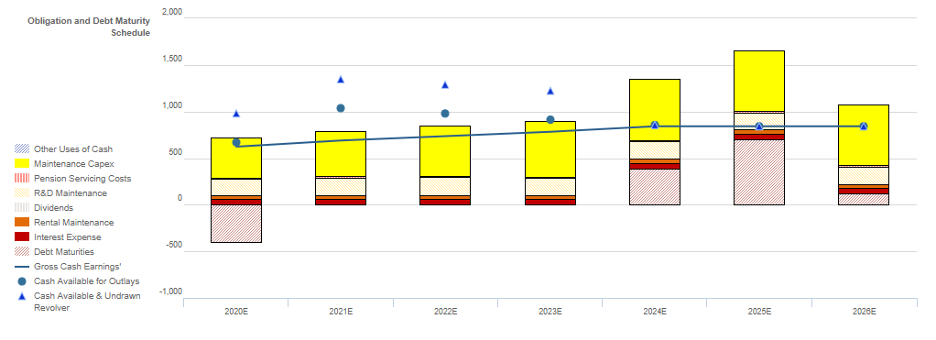
The chart below explains Viasat's credit risk. It compares the company's obligations (stacked bars) each year for the next seven years against its cash flow (blue line), plus cash on hand at the beginning of each period (blue dots).
The bottom bars are the ones that are least easy for the company to "push off," with costs such as debt maturities and interest expense. The higher bars are obligations that are more discretionary, like maintenance capital expenditures ("capex") and share buybacks.
Once we consider the company's liquidity, capex flexibility, and debt maturities, Viasat looks far less risky. The company's cash on hand, including revolver capacity, is enough to meet all obligations until 2024.
While Viasat is highly levered, it has no material debt maturities until that year. The company also has some capex flexibility, as it can cut this spending to free up additional cash. It doesn't really do maintenance on satellites for the most part (they're somewhat hard to get to). This would really be replacement capex.
Based on our CCFP analysis, Viasat appears likely to survive the next couple of years without any real risk, hence why Valens Research – the firm that powers Altimetry – rates Viasat an "XO" (a "Baa3" equivalent). This is nearly five notches higher than Moody's rating, and takes Viasat from a high-yield name to just below "investment grade" in our framework.
Viasat looks like a looming disaster when looking at traditional debt ratios. However, when examining the company from a Uniform Accounting perspective, investors can see the real credit data and timing of obligations.
Viasat may run into problems when its debt matures in 2024 and beyond, but it still has a long time to improve cash flows or refinance. It doesn't make much sense to treat the company as an imminent credit risk... like the markets are currently pricing in.
Regards,
Rob Spivey
September 9, 2020