We've talked regularly about the coming 'Big Bath' in earnings, now let's talk about what to do about it...
Late last month, we highlighted in the Daily Authority (and in Forbes) that second-quarter earnings are going to be ugly due to the earnings "Big Bath."
We also noted that the market is not pricing in the potential aftershock, and explained why that means more volatility and a potential sell-off is likely on the way.
We started to see volatility grow and stock prices fall last week because of surging coronavirus cases across parts of the U.S. Earnings results are going to add to concerns about the economy. So what should you do if a steeper sell-off happens?
We published another article in Forbes last week touching on this exact issue, titled Timing The Market: How Warren Buffett And Disease Research Explain Its Ineffectiveness.
In short, we suggest dollar cost averaging. You can certainly allocate more capital as the market goes down to get better values, but if you just stick to dollar cost averaging, you take the emotion of trying to pick the bottom out of the equation.
When the market is dropping, it's tough to remain rational if you don't have a longer-term plan.
While that's the most important point, the article has more takeaways than just that. We hope you enjoy the read!
It's important to learn valuation from the greats...
The most successful investors in history don't think about investing like most people do.
If you've ever taken a finance class, worked in finance, or read books about investing, you might remember the traditional model for valuing companies.
Most valuation models are built on a number of assumptions, like forecasting a company's future cash flows, trying to predict how much money it will reinvest into the business, and guessing how factors like inflation and interest rates will change.
After inputting all of your assumptions, you can run calculations for the company's future earnings in order to estimate how much its stock price should be worth today.
But seasoned investors know this type of modeling is a no-no.
Any worthwhile investor would tell you that you can't start with a series of guesses and assumptions. Instead, you need to understand the company's embedded expectations.
Bill Miller, former Chief Investment Officer at Legg Mason, said it clearly...
Unless an analyst explicitly addresses the expectations embedded in the stock and then clearly explains how his or her view differs from what the market's implied expectations are... one can be sure that any relation between the rating and the subsequent performance of the stock is pure accident.
Miller's point is an important one. Without calibrating your model to what the market is currently thinking, it's impossible to know if your expectations differ.
Top-tier investors spend far more time understanding what the market thinks than developing their own assumptions. It's a waste of time to do it any other way.
After you understand a company's embedded expectations – what the market is currently pricing the company to do – you can consider whether those assumptions make sense.
That's when it makes sense to build a model – whether it's a complex discounted cash flow ("DCF") model or a simpler comparison metric like price-to-earnings (P/E) or the company's enterprise value ("EV") divided by its earnings before interest, taxes, depreciation, and amortization ("EBITDA").
These ratios are popular because they act as a heuristic for a DCF model. Higher values imply stronger future cash flows than lower numbers do.
In any case, the point of the model is to estimate the company's future cash flows to determine its current value. DCF models offer more "control," whereas simple ratios like P/E and EV/EBITDA are a much faster process with a similar result.
Unfortunately, most investors still miss the first step when they build a DCF model: They never solve for the current market price to understand the company's embedded expectations.
Another heuristic we can use is a company's valuation relative to its asset base.
Companies with high returns and strong growth tend to trade at a higher premium relative to the book value of their assets because the market is willing to pay a premium for above-average returns and the ability to compound those returns through growth.
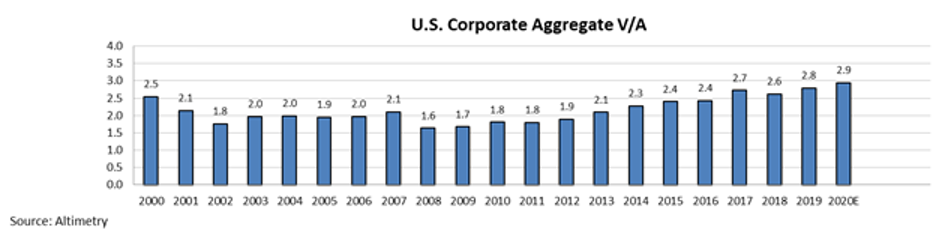
We call this metric value-to-assets (V/A), which is an adjusted version of a standard price-to-book (P/B) ratio.
By looking at these signals in aggregate, we can run the same type of analysis on the entire stock market's V/A.
Right now, aggregate V/A is at an all-time high, even higher than at the end of 2019 or this past February right before the market crashed. Take a look...
Part of the reason valuations are so high is the stock market is almost back to its pre-pandemic highs, but it also has to do with corporate debt.
Unlike traditional P/B, V/A considers a company's full EV, not just its market capitalization.
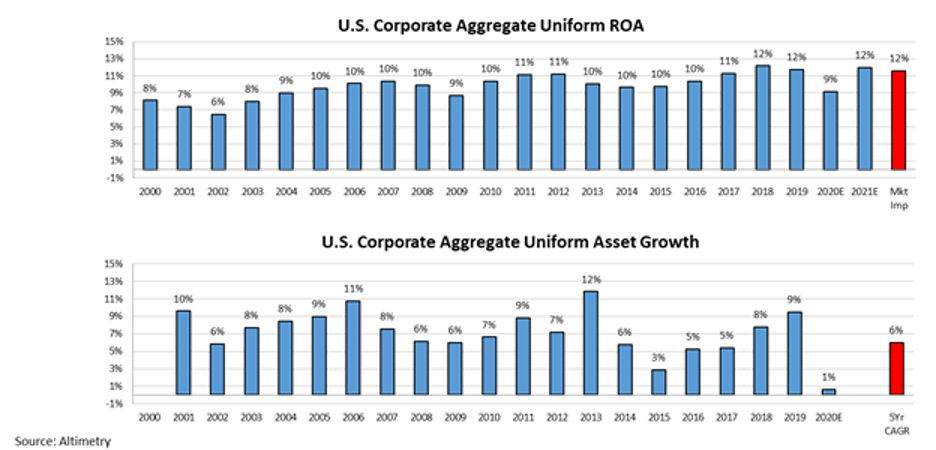
Thinking about what this means for the market's embedded expectations, investors already expect returns to return to all-time highs, with stable growth over the next five years.
While these expectations aren't unreasonable considering how quickly we think the economy will be able to recover post-pandemic, they imply that the market is already pricing in fairly bullish expectations.
At these valuation levels, the market may have limited fundamental upside right now. Meanwhile, any coronavirus disruptions could lead to much larger downside in stocks.
Regards,
Rob Spivey
June 29, 2020