English mathematician Charles Babbage is one of the true fathers of the modern-day computer...
More than 150 years ago, he stunned audiences with inventions that created automated computations.
When introducing his "Difference Engine" and its capabilities, Babbage commented that he had received a particularly puzzling question "more than once"...
If you put into the machine wrong figures, will the right answers come out?
Babbage couldn't rightly determine how someone would even think to ask that question. As he said...
The errors which arise from the absence of facts are far more numerous and more durable than those which result from unsound reasoning respecting true data.
Today, any data scientist worth his salt knows that 95% of the work is cleaning up the data. Only 5% of the effort goes to drawing conclusions if the information going into the analysis is as accurate as possible.
Financial-services giant Goldman Sachs (GS) recently created an index of 'non-profitable' technology companies...
It's a basket of publicly traded companies with negative earnings. As we explained earlier this year, the index has skyrocketed since last March...
This growth of more than 400% beats out the S&P 500 Index and the Dow Jones Industrial Average over the same period... and this is all from companies with no GAAP profitability.
Many investors point to this as a reason to think that the market is in a bubble... and is heading for collapse.
Pundits are claiming fundamentals and stock prices have become completely divorced from one another.
However, from years of study, we have a different view here at Altimetry...
Rather than a bubble, this shocking result may come from using the wrong data.
Many of the companies in Goldman's basket aren't non-profitable. In fact, several could be described as incredibly profitable. The index's massive move higher is at least partially due to phenomenal companies generating big earning power.
Goldman suffers the same root problem that plagues a great number of Wall Street analysts. They pay an unfortunate and overwhelming amount of attention to earnings based on as-reported GAAP financial metrics.
They continue doing this despite outright statements from legendary investors like Benjamin Graham, Warren Buffett, and Seth Klarman that as-reported earnings need to be adjusted. Otherwise, they'll mislead investors.
Some Wall Street analysts have realized this... But their solutions have compounded the problem.
They've created their own supplemental non-GAAP calculations to be used side-by-side with their GAAP as-reported commentary and estimates.
There's no uniformity whatsoever across their non-GAAP data. The Wall Street analysts' adjustments to GAAP are seemingly arbitrary in nature... inconsistent from company to company... and even inconsistent from year to year for the same business covered by the same analyst!
Wall Street's GAAP and non-GAAP numbers are a mess. It's a case of "garbage in, garbage out."
Here at Altimetry, we clean up the financial statements before we try to draw a conclusion about a particular stock...
Our Uniform Accounting process calls for more than 130 adjustments to a company's income statement, balance sheet, and cash flow statement. This gives us an accurate picture of its real earnings, assets, liabilities, and a host of other important metrics.
Without cleaning up the data, you end up with a big problem. For example, with garbage data going into Goldman's "negative earnings" index, garbage conclusions come out...
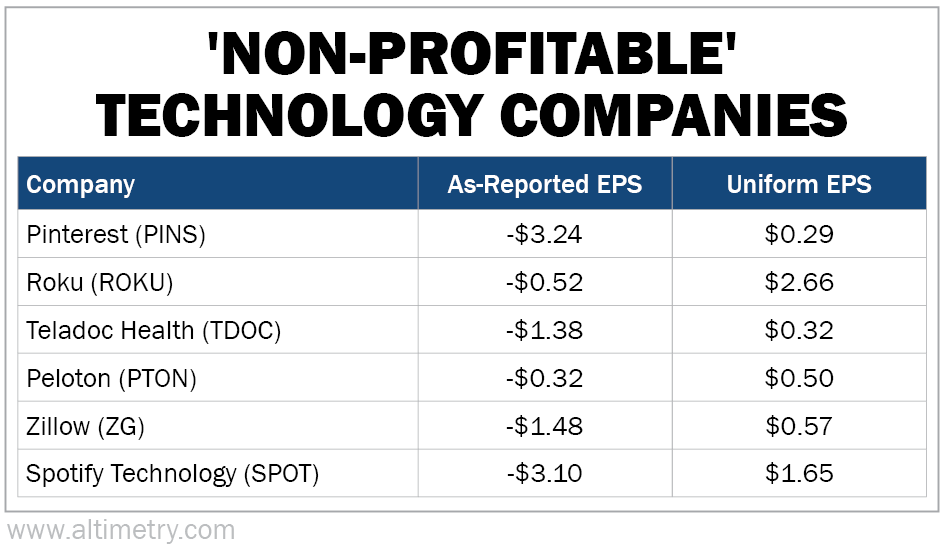
Pinterest (PINS), Roku (ROKU), Teladoc Health (TDOC), Peloton (PTON), Zillow (ZG), and Spotify Technology (SPOT) are all included in the Goldman index. They've all been poster children of the "non-profitable tech" run.
In reality, these firms have produced positive earnings per share ("EPS")... which GAAP metrics and Goldman fail to capture. Just take a look at the stark difference once we clean up the numbers...
Don't make the same mistakes as Goldman and Wall Street...
Using the wrong data will lead to the wrong conclusions... And the results can be a disaster for your portfolio. It's critical to make your investing decisions based on the real, Uniform data.
That's why we created our Altimeter tool.
With a database of thousands of U.S.-listed companies, The Altimeter shows you how stocks grade based on the Uniform data. You can see the direct comparisons of Uniform and as-reported data for metrics like price-to-earnings (P/E) ratios, EPS, and more... It could mean the difference between picking a stock poised to soar or one primed to collapse.
Learn more – including how to get a free 90-day trial – right here.
Regards,
Joel Litman
April 16, 2021