Even the largest businesses start small...
Excluding banks and insurance firms, more than 100 companies in the U.S. have a market cap greater than $50 billion. These mega-cap names are world-beating businesses that dominate their industries.
Some investors talk about how "network effects" and "scale" mean these companies are unstoppable, and they pile into the stocks. But most people forget there were many successful big companies before the headline-dominating "FAANGs" – Facebook (FB), Amazon (AMZN), Apple (AAPL), Netflix (NFLX), and Google parent Alphabet (GOOGL).
Many of those historic big firms didn't survive... no matter how bullish investors were about their "perpetual" economic moats.
Just when investors start thinking large companies are going to remain big forever is often when they're most ripe for disruption. And today, those 100 mega-cap companies are a prime example...
Of these, 47 of them were microcap companies – with a market cap less than $1 billion – at some point in their lives. Nineteen of those 100 names were microcaps as recently as in 1990.
An investor who bought software company Salesforce (CRM) when it broke a $100 billion market cap has seen the firm grow by 65%... But someone who bought Salesforce in 2004 when it was a less than $1 billion microcap name has seen the stock rise by 59 times. If he put $10,000 in the stock in 2004, it'd be worth $608,000 today.
Back in 2002, Netflix was a $115 million microcap stock... Today, its market cap is more than $215 billion.
Even Amazon was a $400 million microcap stock at one point in 1997, before it became a $1.5 trillion behemoth.
While some investors focus on those mega-cap names and hope they can just keep on getting bigger, savvy investors look for smaller companies that can get big. And the best place for individual investors to find those ideas before Wall Street starts to pile onboard and cause stock prices to take off is in the microcap space.
Big institutional investors are just too large to invest down here, because the stocks aren't liquid enough for them to put money to work. On the other hand, individual investors who can do sound research, identify the next wave, and avoid companies with more questionable backgrounds can therefore build positions before these stocks start to rise... and before they appear on institutional investors' radar.
And that's when these names take off.
We're excited to announce a brand-new product that can do just that for readers – identify the microcap companies primed to take off that big investors aren't paying attention to yet.
It could be the biggest money-making opportunity of the next decade... A chance to realistically make 10 times your money on a single investment.
We've even prepared a video to tell you about the opportunity. Click here to find out more.
Restaurants are in rough shape...
It's no surprise that after nearly a full quarter of no (or-limited) dine-in service across the country, many restaurants have closed permanently.
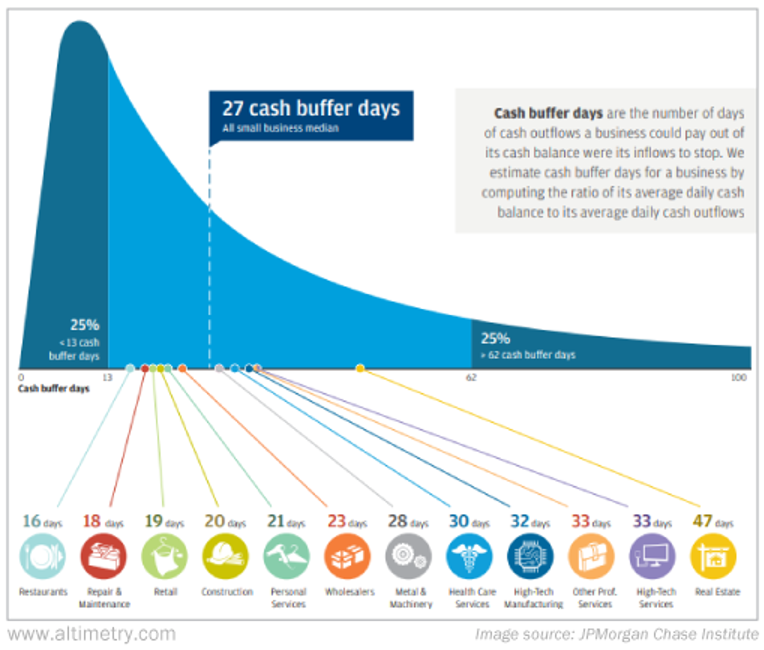
In the March 27 Altimetry Daily Authority, we included an infographic from investment bank JPMorgan Chase (JPM) highlighting how much cash on hand companies across many industries tend to carry:
It was bad news for restaurants... They came in dead last, with an average of only 16 days' worth of cash to cover operating expenses.
That's a thin margin, hence why many of them have had to call it quits.
In mid-May, OpenTable released a report stating that after the pandemic, as many as 25% of restaurants across the U.S. will close permanently.
That number could end up being higher depending on whether cities and states have to shut down again for another spike in coronavirus cases.
Even the restaurants that are starting to open back up are doing so slowly, often at less than 50% total capacity.
Restaurant income statements and balance sheets aren't designed to run on 50% capacity, so the entire industry could be seriously delayed in returning to full strength.
Such a huge change in the restaurant industry could have even worse effects on the broader food supply chain.
One food supplier immediately comes to mind – Sysco (SYY).
The company is among the biggest food distributors in the world. It serves approximately 650,000 customer locations, which span from restaurants to hotels and hospitals.
As of its most recent financial report for the quarter ending March 28, Sysco had already lost 6.5% of its year-over-year sales.
Most U.S. cities and states didn't start shutting down restaurants until mid-March, meaning most of that drop is from just two weeks of the full quarter.
Considering April, May, and most of June were spent on lockdown in much of the country, it's hard to imagine a situation where Sysco's next quarter is stronger.
That said, recently, Sysco's profitability hasn't been all that damaged by changes in the restaurant industry.
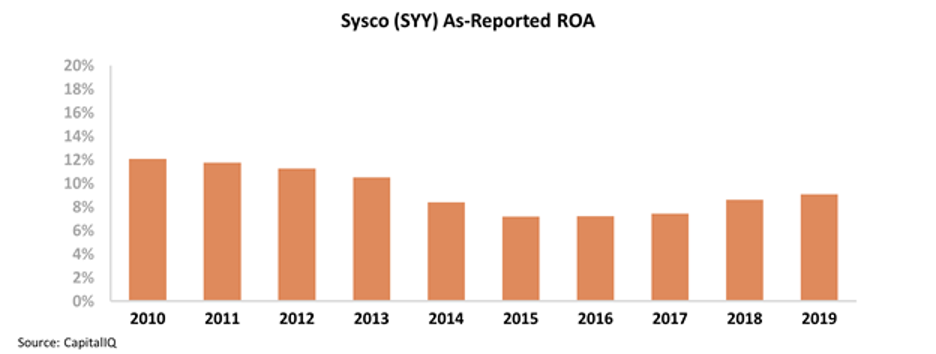
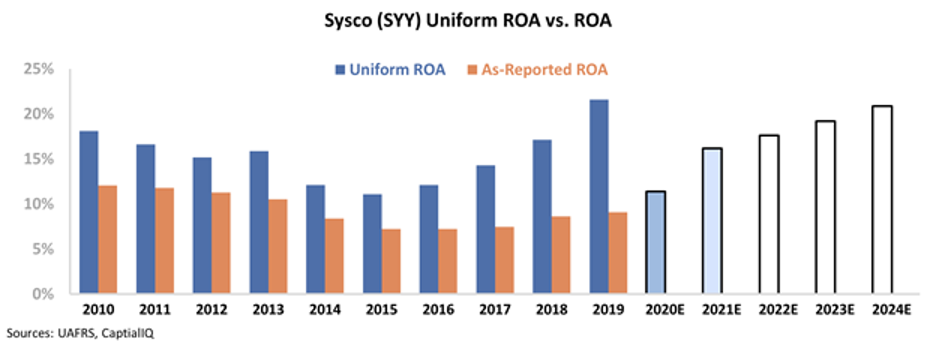
In the first half of the 2010s, the restaurant industry was in cyclical decline... and Sysco saw its as-reported return on assets ("ROA") come under pressure. The company's returns fell from 12% in 2010 to 7% in 2015.
On the other hand, even as restaurant growth has accelerated over the past few years, Sysco hasn't seen any material recovery in ROA – its returns only rose modestly to 9% by last year.
Considering it hasn't seen a recovery with the updraft in restaurants, perhaps Sysco will be able to emerge from the pandemic relatively unscathed, with no drop in returns.
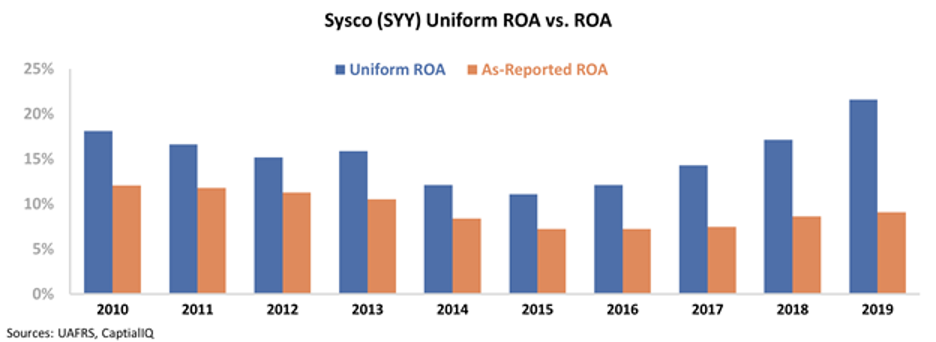
Unfortunately, our Uniform Accounting metrics see things differently...
After removing the effect of distortions like goodwill, accounts payable, and operating leases, it's clear that Sysco's true profitability has been tied directly to the restaurant industry over the past decade.
Sysco's Uniform ROA fell from 18% in 2010 to a low of 11% in 2015 from a mix of declines in the restaurant industry and rising competition from other distributors.
Beginning in 2015, Sysco started investing in its international segment as a way to diversify its business, and took advantage of improving conditions in the restaurant market. The company's Uniform ROA steadily improved to a new high of 22% in 2019.
Surprisingly, even in the face of the current restaurant environment, the market expects that to continue.
The chart below highlights Sysco's historical profitability in terms of Uniform ROA (dark blue bars), compared to analyst estimates for the next two years (light blue bars), and market expectations at current stock prices (white bars).
Unsurprisingly, analysts expect Uniform ROA to get cut in half this year. That being said, after that, investors are already pricing in a full recovery back to peak profitability levels.
This is possible in the long term... But as we said earlier, it might take several years for the restaurant industry to fully recover. We likely haven't seen the worst of business closures yet... and if we get anywhere near the 25% closure rate that OpenTable suggests, current market expectations might be entirely too bullish.
It appears Sysco is more exposed to restaurant industry cycles than the market realizes, which is likely due to misleading as-reported financial metrics. But the Uniform data show why Sysco might not be able to bounce back so quickly...
Regards,
Joel Litman
July 9, 2020