Prices are on the move...
The steep surge in commodity prices keeps hitting the headlines today.
The price of lumber, semiconductor chips, gasoline, grocery store staples, and even the lattes sold at your local coffee shop cost more now.
The used car market, known for its rapid depreciation, not appreciation, is up more than 40%.
Much of this inflation is transitory, with a better picture slowly coming in. The several "nightmare months" at the start of the pandemic shocked the delicate global balance of supply and demand. As our economy largely relies on "just in time" logistics, the consequences are still being drawn out.
The just-in-time model is when companies order their inputs to arrive when they need them to avoid filling warehouses with materials.
With the just-in-time model so sensitive to supply shocks, small delays cascade down the supply chain and cause mass shortages. The current supply chain shortages and the post-pandemic surge in consumer demand are causing prices to increase across the board.
Thankfully, most signs point to it being temporary.
More importantly, this isn't the "by the book" inflation that worries economists. That type of economic concern refers to currency devaluation amid a flailing economy.
But the asset class most relevant to the middle class may not be so lucky...
Home prices have been on a nonstop tear, even before the pandemic. But the pandemic added fuel to the fire.
According to Zillow (ZG) estimates, the typical home in Dallas sold for nearly $262,000 in 2020 but sold for around $306,000 this year. This reflects not just the listing values of homes but actual transaction data.
Home values in Dallas rose 17%. It's not an isolated incident but a fairly tame case. It pales compared to the rise in prices in popular locations for the new remote worker, such as Truckee, California.
In Truckee, a real estate agency reported that transacted single-family home prices shot up nearly 90% in one year.
Many people are understandably spooked. It seems as though we've been here before, riding the wave of rapidly rising home values into another dark recessionary abyss.
But as the data shows, not everything is the same as in the mid-2000s.
Rising home prices don't tell the whole story...
Comparable metrics of affordability can tell us if homes are becoming more expensive than other options.
The rental market, being the only viable alternative to ownership, is the logical place to look. By comparing the ownership costs with the proceeds from renting, we can check whether the housing market is overheated.
This can be rolled up into the aggregate price-to-rent multiple for housing. At the peak of the subprime mortgage bubble, price-to-rent was 41 times. In other words, it would have taken 41 years of collecting market rent for a property to pay back its value, assuming prices and rental rates held steady.
Today, price-to-rent is at 29 times, lower than it was in 2006.
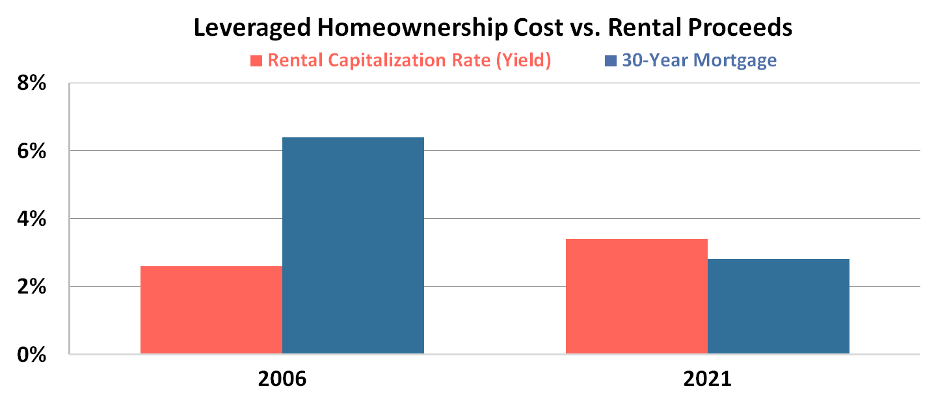
Another way to think about this is in terms of yield. The 41 times price-to-rent multiple in 2006 meant rental homes yielded their owners, on average, 2.4%. Today's yield is a better 3.4% on a cash basis.
However, the cash basis is mostly irrelevant because people don't buy homes with cash. They tend to use leverage. Once you add the cost-of-debt variable into the mix, the differences between 15 years ago and today are more evident.
At the beginning of 2006, the average 30-year mortgage rate was 6.2%. Given that the rental yield was only 2.4%, purchasing a home as a rental unit was generally a losing proposition. You would be losing nearly 4% per year on interest.
Today the average long-term secured mortgage is around 2.8%, and the rental yield is 3.4%. That makes rental properties profitable today.
The same strategy that would have lost you roughly 4 percentage points per year would be a viable investment today.
Today the economics of buying a home still makes sense.
Prices are rising because of shifting demand trends and a general lack of home availability. Conclusion: We're not in a bubble... just yet.
When analyzing the housing market, the economy, or a stock, know that there's always more to the story...
If you're looking for monthly insights pulling together the facts of the market – and exactly how you should be adjusting your investment strategy – our Altimeter service has the answers...
Along with giving Altimeter subscribers access to the Uniform Accounting data for more than 4,400 companies, we break down important economic trends in our monthly Timetable Investor feature. This tells you exactly how to navigate concerns like government spending and stimulus, inflation, supply shortages, and more.
If you aren't an Altimeter subscriber, click here to find out how to gain instant access to the rest of the Uniform data.
Regards,
Rob Spivey
August 16, 2021