Dear reader,
In 2017, anyone thinking of buying online-retail giant Amazon (AMZN) saw a massive price-to-earnings ("P/E") ratio of 190. With a P/E ratio this high, many people likely walked away from the stock... and missed out on a 50% gain since then.
In 2015, investors looking at social media giant Facebook (FB) saw a P/E ratio of 40. Anyone who couldn't stomach holding their nose and buying anyway has missed out on a 75% gain.
You might think valuations don't matter... "Buy great companies, and everything will be all right."
But the reality is... the people who bought those companies did so because they knew those P/E ratios were wrong.
And there's a simple way that you can see the real numbers on any company that you're interested in buying. I'll share how in a moment.
But first, I want you to see just how powerful knowing the real P/E ratios can be.
For both Facebook and Amazon, as-reported accounting distorted the real earnings numbers. But once we apply our Uniform Accounting metrics, we can quickly understand the real valuations in the tech industry.
In 2015, FB was actually trading at a Uniform P/E ratio of 21... while AMZN was trading at a Uniform P/E ratio of 51 in 2017.
These real numbers show that these companies were much less expensive than the market expected. In reality, Facebook was about half as expensive as the market thought... and Amazon was only about a quarter as expensive. Given their massive growth potential, they were much more attractive investments.
And there are plenty of other businesses that have these distortions...
As-reported accounting gives completely wrong signals on valuations on thousands of companies in our Altimeter database.
The tech sector is particularly rampant with problems. The complexities of the as-reported financial statements for these companies can create significant distortions that can lead investors to think these businesses are significantly more expensive – or cheaper – than they really are.
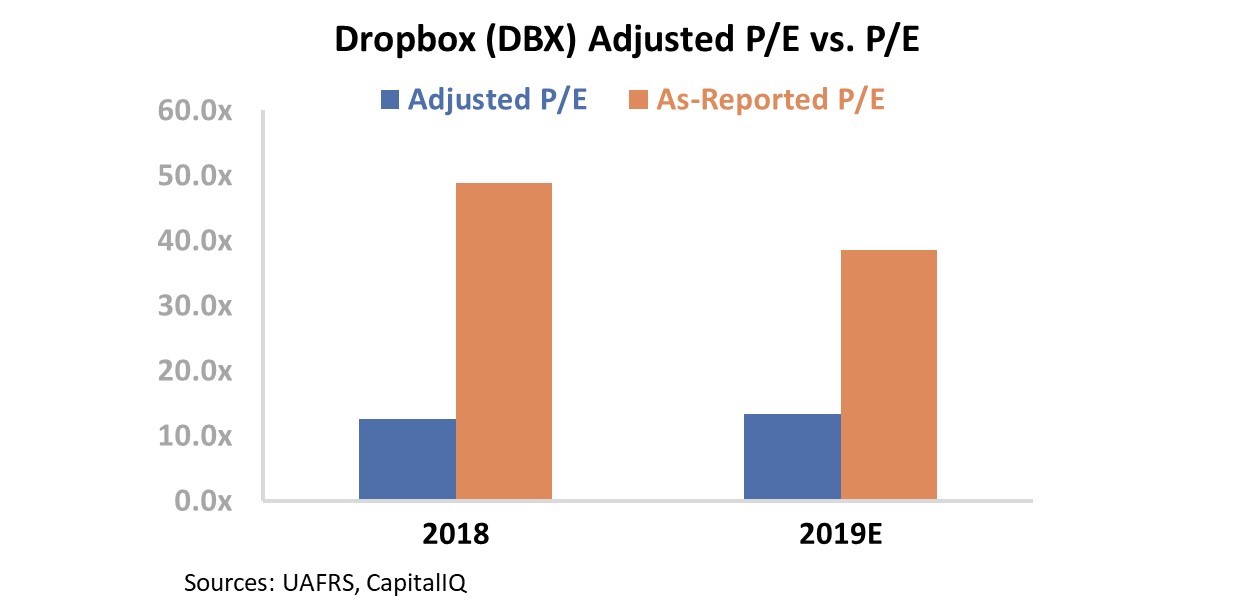
For example, take file-hosting service Dropbox (DBX). On an as-reported basis, it looks expensive. Since its initial public offering ("IPO") in 2018, the company has traded well above corporate average valuations, recently reaching a low of a P/E ratio of 41.
The reality is way different...
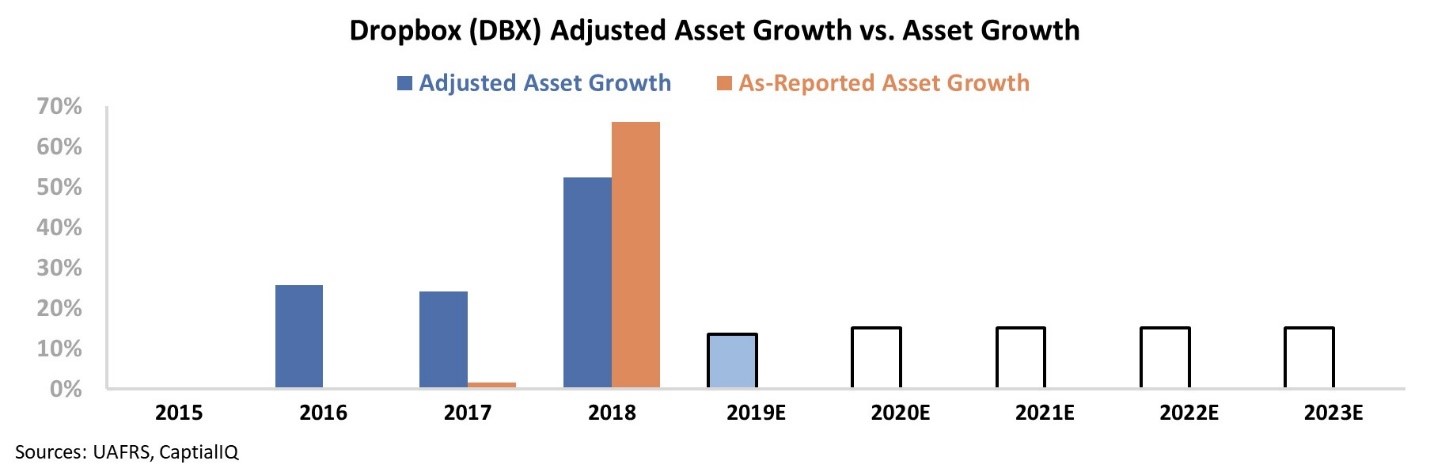
When looking at Uniform Accounting metrics, we can see the stock has actually traded for a P/E ratio of around 12 to 13 since 2018 – well below corporate averages. Furthermore, Dropbox has consistently grown its assets more than 20%, and it only needs to grow 15% going forward to justify its current valuations.
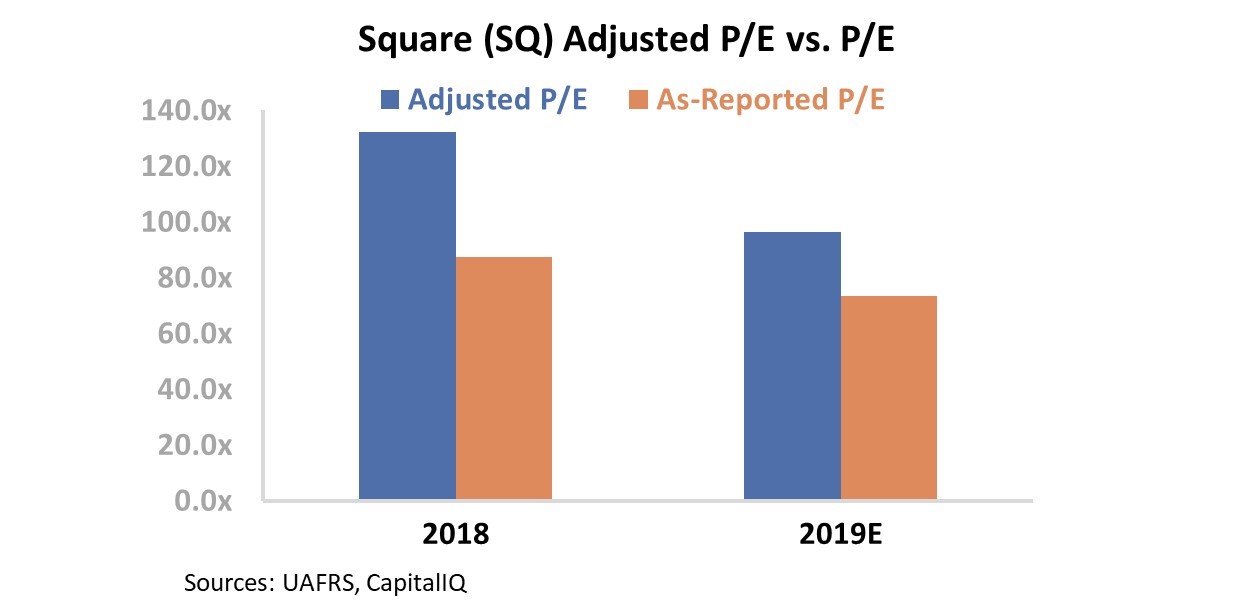
Or look at payment company Square (SQ)... This time, as-reported metrics make the business look relatively cheap.
If you trust the regular numbers, the company looks within reason following its recent drop in stock price – it's trading at a P/E ratio of around 74. While this is still very high relative to most companies in the market, it's not far from Amazon's P/E ratio of 51 in 2017. Given that Square is still growing aggressively, this might appear to be an opportunity to buy. But in reality, the company is trading at a Uniform P/E ratio of 96 – well above reasonable levels.
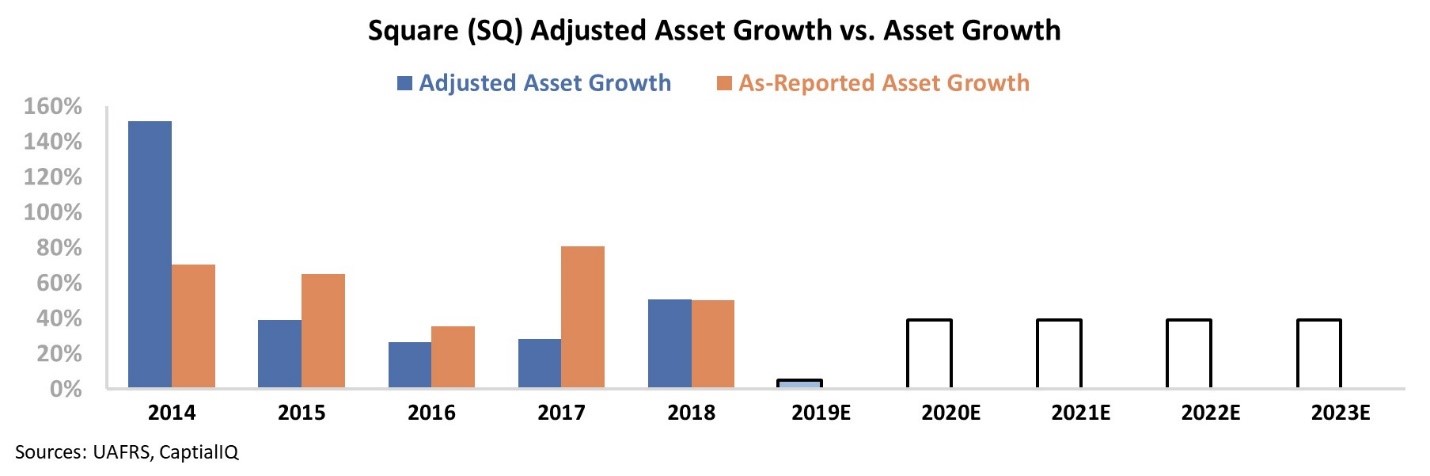
Square needs to maintain a 40% annual growth rate to justify these valuations – this is far above what it has been able to do historically, and much higher than analysts expect.
For perspective, at a 40% growth rate, Square would be doubling in size roughly every 20 months. In three and a half years, the company would need to be four times bigger than it is today...
As you can see, even the most popular investing metrics in the world aren't immune to distortions. No investor would willingly use numbers they knew weren't correct. Uniform Accounting can help you see the real trends you otherwise might miss across entire industries.
And these companies are just the tip of the iceberg. Below, we've highlighted 10 of the largest dislocations between as-reported P/E ratios and Uniform Accounting-based P/E ratios in the tech industry.
Take a look...
| Ten Biggest Tech P/E Dislocations |
| Name |
Ticker |
As-Reported P/E Ratio |
Uniform P/E Ratio |
Difference |
Description |
| Dropbox |
DBX |
40.8x |
13.3x |
27.5x |
P/E ratio is well below corporate averages and the company is still growing at 20%-plus every year |
| Littelfuse |
LFUS |
29.8x |
17.9x |
11.9x |
Current valuations are pricing in below-average expectations, but its return on assets ("ROA") is improving and growth is strong |
| Acacia Communications |
ACIA |
31.5x |
21.7x |
9.8x |
The market is pricing in expectations for muted ROA and growth at market average levels |
| Cognex |
CGNX |
51.3x |
41.9x |
9.4x |
The company has grown its assets between 10% and 27% in each of the last four years. Adjusted P/E ratio is still high, but justified at these levels of growth |
| Advanced Micro Devices |
AMD |
33.7x |
25.2x |
8.5x |
AMD looks expensive, but is really trading near corporate averages with record-high ROA and 18% growth in 2018 |
| Itron |
ITRI |
25.0x |
17.2x |
7.8x |
Valuations are below corporate averages, not above – as traditional metrics would suggest |
| VMware |
VMW |
24.0x |
21.7x |
2.3x |
ROA expanded from 16% in 2017 to 59% in 2019, and markets are pricing in expectations for ROA to stay flat |
| Global Payments |
GPN |
23.3x |
32.4x |
-9.1x |
Above-average valuations are pricing in lofty ROA expectations and limited growth potential |
| Fiserv |
FISV |
22.6x |
33.4x |
-10.8x |
Valuations are more expensive than as-reported metrics highlight. Markets expect ROA to reach historically high levels |
| Square |
SQ |
73.5x |
96.4x |
-22.9x |
Despite high growth, valuations are astronomically high compared to earnings |
Regular Altimetry Daily Authority readers are familiar with our work analyzing individual companies.
We put significant investment in that research. We have a team of 100 people, including accountants and researchers that clean up the numbers to get to the real Uniform Accounting metrics and help us with fundamental research.
Without the Uniform Accounting data, we'd be stuck picking stocks with the same bad as-reported data that other investors use... And bad data lead to bad investment ideas.
But of course, we know that you're interested in more companies than the one we might choose to write about each day or recommend each month in our High Alpha letter... Plus, you probably own quite a few companies in your portfolio that you want to see the real Uniform Accounting numbers for.
That's why we are now offering exclusive access to our special tool that can let you see the cleaned-up performance and valuation data for the companies you want to invest in. These are the same "fixed" numbers that power the research we're doing on a daily basis.
We call it The Altimeter – and it's perhaps better known as the "Investment Truth Detector." It sees through the accounting noise to help you better understand the companies you want to invest in.
To highlight the power of The Altimeter, every once in a while we're going to use it to identify bigger dislocations for an entire industry or sector and highlight them right here in Altimetry Daily Authority... like we did today with the tech sector. It's one of the most powerful tools in our arsenal... and it's dead-simple to use.
Just type in the stock ticker of any U.S.-listed stock that you want to know more about... and immediately see its true earnings number – plus where it's likely going next.
To learn more about The Altimeter and how to get access to the whole database, click here. (Altimetry Partnership members can access the database right here.)
Regards,
Joel Litman
November 14, 2019