Credit is the gasoline that the economy runs on...
Here at Altimetry Daily Authority, we often talk about the importance of credit and the credit cycle in the health of the economy.
If the economy were a big machine, the pistons and gears would be the workers and companies that make up the GDP. However, credit powers the entire process.
When we talk about credit, we're normally referring to the effect of credit as the gasoline to the "real economy" – meaning companies, individuals, or even the government borrowing funds to invest and keep the engine running.
This borrowing allows governments to invest in infrastructure, companies to invest in new manufacturing plants and grow earnings, and individuals to buy cars and houses. This earnings growth is also what keeps the stock market trending upward over time.
But there's another form of credit that doesn't make it into the real economy. And yet, it has a direct effect on corporate valuations. Investor credit, by way of margin accounts and artificial leverage through options, also directly drives the stock market.
If an investor has conviction for a stock going up or down, he could buy on margin or use options to magnify returns. By borrowing money to buy stocks, if an investor is right, he only has to return the initial outlay plus interest – thus keeping the extra profit.
If the stock collapses, that investor could lose more than 100% of his investment.
When a lot of investors are leveraged to the hilt and the market takes a step back, waves of margin calls and defaults can turn a modest pullback into a bigger sell-off.
This is what happened to Archegos Capital Management during its recent collapse. The fund was using complex financial instruments with leverage. Then, when a few trades moved against it, the fund was forced to unwind all of its positions to cover its debts.
As recent FINRA and Advisor Perspectives data highlight, it's not just the funds like Archegos becoming overexposed... Margin debt is climbing rapidly across the board.
When everyone is 'all in' on the market, any bad news can quickly snowball in the wrong direction...
Typically, to measure the risk of margin debt, people will look at how much credit people have taken out in total.
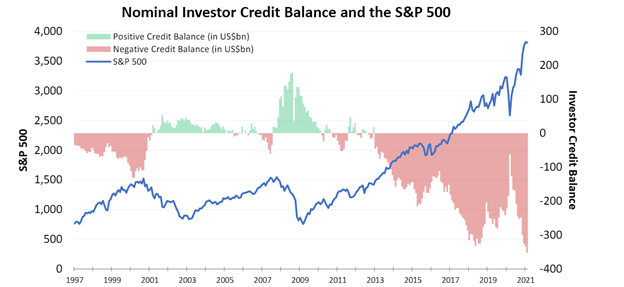
The chart below shows when investors have a positive "credit" balance in green – meaning they're net cash – and when they're actively taking on margin debt, which is when the chart goes red.
As you can see, since 2013, we've witnessed an increasingly negative nominal credit balance as investors have taken out money to fund stock purchases.
This chart would indicate that we're at all-time highs for margin debt... which would mean we should be preparing for the worst: a margin-led stock market pullback.
However, here at Altimetry, we know that a more nuanced approach is required for looking at the data...
Context is key to measure real risk. This chart fails to take one important piece of context into account.
Market levels themselves have a large effect on the value of margin, as wealth is being created and destroyed by the stock market every day.
When the S&P 500 Index is at 1,500 like it was back in 2000 and 2007, the total market cap of its constituents was $12 trillion to $13 trillion. Back in late 2018, when the S&P 500 approached 3,000, the total market cap of its constituents was almost $25 trillion.
Right now, the S&P 500 sits above 4,000... and total market cap is at $35 trillion.
Since there's a lot more wealth sitting in the S&P 500 – and in the market as a whole – higher margin debt doesn't mean people are necessarily leveraged to the hilt. Investors also have a lot more equity.
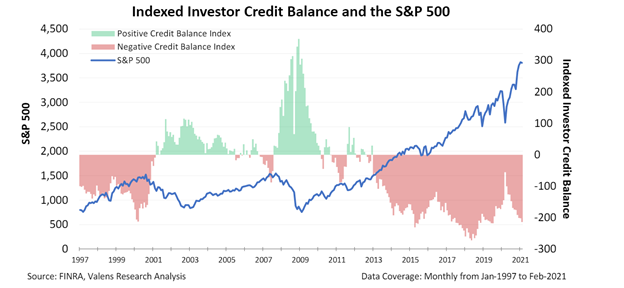
To take this into account, when measuring margin debt, we index it against the S&P 500 to get the right context...
Once we normalize everything, we can see conditions are still concerning... but not as apocalyptic as they initially appear.
First, as you can see in the next chart, investor credit balances aren't as high as in mid-2018, when things really got extended.
That said, they're still at levels seen in 2000 (right before the dot-com bubble burst), in 2015 (before the oil bubble burst), and in 2019 (before the coronavirus pandemic).
This means even after we adjust for the wealth created in the S&P 500, investors are still exposed to a lot of debt in the market.
Of course, just because margins get high doesn't mean a market collapse is imminent...
For all the "teeth gnashing" of 2015, while outstanding margin debt was near all-time highs on an indexed basis, the marked quickly recovered through 2016 and beyond.
The market simply needed time to digest this leverage, which meant a sideways-to-slightly-down market rather than a spiraling collapse.
Similarly, while we saw a sell-off in the end of 2018, the market quickly rebounded after this overexposure was worked through. At the time, the underlying businesses didn't suffer from credit issues, which are the causes of prolonged recessions.
So, just because there are elevated levels of investors trading on margin, it doesn't mean the market is ready for a total collapse. Corporate credit levels are still strong.
However, investors should be ready for volatility in the short term, similar to 2015 and 2018, as the market digests this recent run in investor excitement and buying on margin.
Regards,
Joel Litman
May 17, 2021