Dear reader,
The talking heads at CNBC and Bloomberg are once again in a frenzy.
Last Tuesday and Wednesday, the small-cap Russell 2000 Index, the S&P 500 Index, and the Nasdaq 100 Index all dropped, and most of the decline was driven by one datapoint.
The Institute for Supply Management's U.S. Manufacturing Purchasing Managers Index (PMI) disappointed investors. Market expectations were for 50.1%, and the PMI dropped to 47.8% instead. Any number below 50% signals a contraction in manufacturing.
Across the financial media, many said this was yet another signal of a recession. This is the second month in a row the PMI came in below 50%... September nonfarm payrolls were below expectations... and the recent Empire State Manufacturing Survey – an indicator of general business conditions in New York state – also missed expectations.
The naysayers claim all these metrics point to an imminent recession... But the reality is that these aren't great indicators.
Regular readers know how much my team and I pay attention to credit signals when analyzing the macro environment. Understanding information like when debt maturities come due, what the cost to borrow for firms is in the market, and what the real risk of default is for corporate debt all are vital indicators of the risk of a recession.
While all those metrics offer plenty of noise, one particularly important metric is the surest sign that a recession is coming. In the past 70 years, there has not been a U.S. recession that this indicator has not predicted... And it hasn't thrown a false positive, either.
When the yield curve inverts – specifically the 10-year and the three-month U.S. Treasury yields – it means a recession is coming.
An inverted yield curve is widely considered one of the strongest and most foolproof indicators of an upcoming recession, but how foolproof is it?
There are many common misconceptions about the yield curve worth clarifying...
At its most basic level, the yield curve tracks economic outlook over various time frames. Under normal scenarios, yields are higher on longer-term U.S. Treasurys, indicating expectations for the economy to continue growing. However, when expectations flip and investors expect a slowing economy, this is reflected in lower long-term yields.
In essence, investors realize although the economy is growing now, that can't last forever. We are in the midst of the longest bull market the U.S. has ever seen... and investors are growing increasingly weary. Looking back through history, bull markets have always ended eventually. This one, with its unprecedented tenure, must also come to an end.
While most media coverage of yield curve inversions cite the spread between the two-year and 10-year Treasury rates as the most important recession indicator, this particular spread is likely to generate false positives. When looking instead at the three-month and 10-year spread, there is a much higher correlation between an inverted curve and a looming economic recession.
This metric flashed a warning signal earlier this year. For eight days in March, the three-month and 10-year spreads inverted. The ratio flipped back for all of April, but it has inverted almost every day since.
At the time, pundits were saying that meant a recession was imminent. How have we not seen negative GDP growth the last two quarters, since that inversion?
There is one major problem with using the inverted yield curve as a recessionary indicator: it tells you a recession is coming, but it doesn't say when.
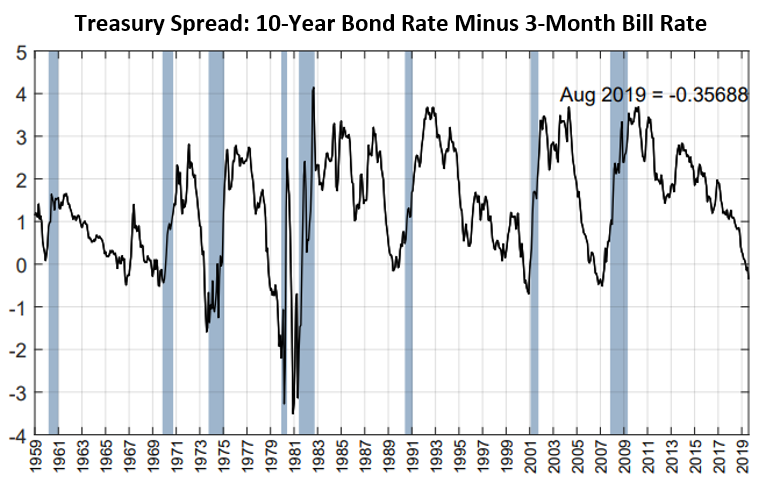
The chart below highlights the spread between the 10-year and the three-month Treasury rates for the last 50 years. Each time the spread dips below zero is an "inversion," and each grey column is a recession.
The 10-year and the three-month yields inverted before every recession over the last 50 years (including the 1967 "non-recession," which was a recession by every classification except in name). However, the timing between the inversion and the start of the recession is less predictable.
On average, there has been a recession about 18 months after the initial yield curve inversion, but these have ranged from less than six months out to as long as three years.
A yield curve can signal a recession is coming. But to understand when a recession is coming, investors need to look at other contextual clues.
The inverted yield curve is simply a signal that we must take greater care in monitoring the market going forward. At this point in the cycle, certain other indicators become increasingly important to track, specifically on the credit side of the market.
Every market recession has begun with a credit crunch.
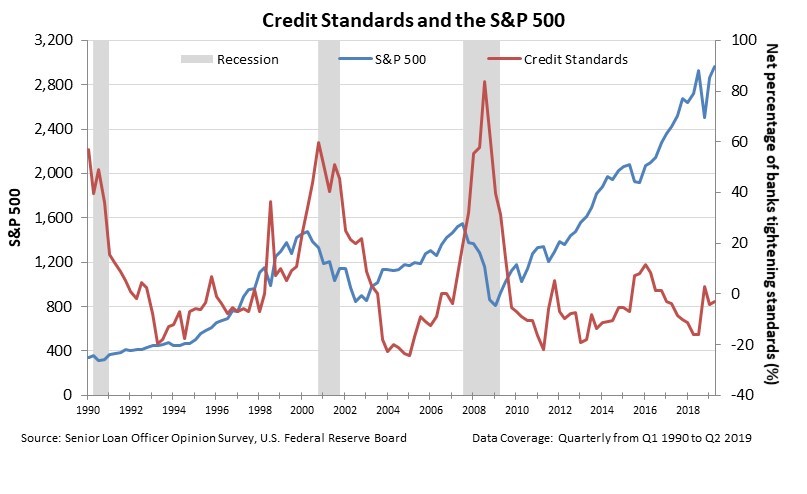
The chart below highlights the importance of monitoring credit standards in the U.S. after a yield curve inversion. When lending standards become excessively strict, creditors can't refinance their debt and a recession is soon to follow. The red line in the chart tracks changes in credit standards. When the line is above zero (on the right axis), credit standards are becoming stricter, and when it is below zero, businesses are getting easier access to credit.
Each of the three recessions pictured (and every recession before that) was preceded by a spike in credit standards. As of the most recent quarter's survey, it is still getting easier for corporations to access credit markets – meaning credit standards are relaxing.
While we are approaching the near-end of a potential recessionary window, there are no fundamental reasons for concern. An inverted yield curve alone will not send us into a recession... It is simply an indicator that we need to brace ourselves and pay greater attention to signals in the credit and equity markets.
As long as lending standards remain fairly lax, and credit headwalls do not become an issue, we do not see reason to believe that an economic recession is around the corner. It is much more likely to be three years out than six months out.
Moving forward, it is imperative to keep an eye on debt levels, lending standards, and refinancing activity – all the metrics we monitor regularly.
Now is not the time to be fearful – it is the time to be mindful.
Regards,
Joel Litman
October 7, 2019
P.S. A lot of experts are foolishly predicting a crash right now... But everyone is looking at the wrong data. I recently explained the massive discrepancy in a special presentation for my "Investment Truth Detector" system. This presentation goes offline tonight at midnight – click here today for the full details.