Ask three different people how inflation is doing, and you'll get three different answers...
It all depends on where you look.
Some folks have felt more hopeful recently. The Federal Reserve's most powerful tool for curbing inflation is raising interest rates. And it hasn't hiked rates since July... including at its first meeting of 2024 this past Wednesday.
But despite that hopeful sign, 2023 ended on a bad note. U.S. inflation hit 3.4% in December, which was a bit more than the 3.2% everyone was expecting. It was also a jump from November's 3.1%.
And if we leave out volatile food and energy costs, inflation was at 3.9%.
Those numbers are bad news for the crowd that thought a "soft landing" was a guarantee. Volatility should be the No. 1 concern for investors in 2024.
So today, I'll discuss how you should approach the market during these unpredictable times.
The folks in charge at the Fed have made it clear...
They don't intend to take their foot off the gas until inflation is under control.
"Control" is the opposite of what we saw in December. With prices starting to creep up again, the Fed's work is far from over.
Many investors were hoping for interest-rate cuts as soon as March. But with inflation on the rise again, the central bank could delay that timeline. We may be looking at weeks, or even months, of uncertainty.
All that uncertainty is what makes the current investing climate so tricky. Nobody is sure what's going to happen in the coming months. Setups like these are some of the most dangerous times to buy into the market... and to leave risky investments in place.
And it's not just uncertainty that's adding risk to today's market. Even in 2020, when COVID-19 had investors heading for the hills, companies were in way better shape.
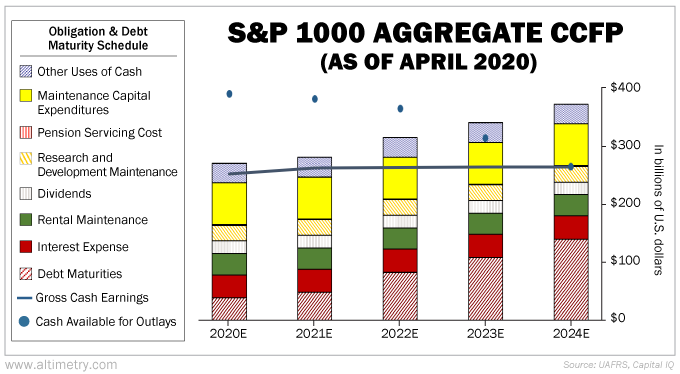
We can see this through the Credit Cash Flow Prime ("CCFP") analysis...
Deep credit research gives us a more accurate sense of the market's overall health. Our macro CCFP takes the Uniform cash flows and cash reserves for U.S. companies outside the banking and real estate sectors and compares them with their annual obligations.
The chart below shows the aggregate CCFP for the S&P 1000 Index, which tracks 1,000 small- and mid-cap companies in the U.S... the part of the market that's more likely to struggle during an economic downturn.
Specifically, it shows S&P 1000 companies with debt outstanding as of April 2020 – back when corporate America was still in good shape.
The blue dots represent the total cash in aggregate, while the blue line represents cash flow in relation to the obligations.
Here's what we were looking at back then...
As you can see, in 2020, cash flows exceeded all obligations. Said another way, corporate America had plenty of cash to keep the lights on... and then some.
Debt started to rise last year. And as we enter 2024, cash flows no longer cover all obligations.
I wouldn't blame you for looking at that chart... and assuming it's time to short the market.
However, as I said, this is a tricky environment. When the market is having a complete meltdown – like it did during the early stages of the Great Recession – it's easy to bet on an imminent plunge.
The toughest setups are like today, when there are signs in both directions.
Credit risk is high. We've been vocal about a looming chain reaction of bankruptcies... which could plunge us into a recession.
Until that happens, though, we can't say it's time to short the market. While December's inflation number was worse than expected... if January's is better, the market could bounce back in the short term.
One thing is for sure... Volatility will drive the market for the foreseeable future.
Wishing you love, joy, and peace,
Joel
February 2, 2024