When the economy moves as fast as it has over the past three months, waiting for official data isn't an option...
Traditionally, economists use metrics such as the unemployment rate, GDP, and inflation to measure economic activity.
However, when listening to investors, journalists, or even central bankers, different measures are being rolled out to help gauge the current crisis because things have moved so rapidly. If you use traditional metrics, everything will have changed before you get the data.
Some of these more abstract indicators range from mobility statistics from tech giants to restaurant booking data from OpenTable.
These metrics released by tech companies attempt to approximate economic activity through some small facet of spending. The investing world is locked onto these alternative metrics, because the turnaround time between being recorded and distributed is much quicker than traditional tools.
With a "first mover" advantage being so important in a time of uncertainty, investors are relying on metrics such as coffee sales because they come out quickly.
And yet, all these are simply stand-ins for economic activity, without a clear benchmark to pre-pandemic levels.
While Apple (AAPL) and Alphabet's (GOOGL) Google can quickly turn around mobility data, this doesn't necessarily highly correlate with a recovery in the economy. As more people are moving across cities or towns, this doesn't necessarily mean they're spending more since March. Furthermore, without the ability to back-test this metric, it doesn't account for seasonal spending.
Furthermore, a measure of table reservations from OpenTable only shows online reservations, not all food spending. Consumers could be spending their income on higher-end ingredients to cook at home, or simply ordering out more to avoid large crowds.
Finally, a measure like credit-card spending from Mastercard (MA) or Visa (V) can be suspect as well. While credit-card sales might be up, consumers may be spending more on their credit cards because of an aversion to touching cash. A misunderstanding of consumer motivations may have analysts incorrectly assume a recovery pattern that isn't actually going to appear.
As the "At-Home Revolution" continues to change people's lives across the country, limited measures of economic activity may serve to muddy the waters of analysis... since traditional patterns may not be consistent with new trends in economic activity. While metrics such as mobility and restaurant bookings have their place, they should be treated with care.
Classic measures of economic activity are proven to measure total economic output and have a long history, so they can be used to compare this downturn with other economic events. While it may take a little longer to get into a reader's hands, it will be worth the wait. Otherwise, you might be caught expecting a very different trend versus reality.
Do you have a non-standard metric you've used to give you a pulse on how the recovery looks? Tell us about it at [email protected].
With any major economic shift, different industries emerge as winners and losers...
The creation of the auto industry helped increase demand for asphalt and fueled the construction industry. On the flip side, buggy makers and horse breeders saw decreases in demand.
The internet boom of the late 1990s brought software and online retail industries to the forefront of society. At the same time, bookstores and the newspaper industry needed to adapt their business model to go online... or face default.
Even within the same industry, economic changes can cause dramatic shifts.
In the wake of the Great Recession, homebuilders of high-end houses saw surging demand, as only higher-income people had access to borrowing. Later in the recovery, those same homebuilders lagged smaller companies focusing on starter and step-down homes.
Similarly, the At-Home Revolution and coronavirus pandemic have dramatically changed the world of retail real estate.
In the June 2 Altimetry Daily Authority, we discussed the negative effect coronavirus will have on commercial real estate ("CRE"). Employers are beginning to realize the value in employees working from home at least part-time.
This shift to online working could spell disaster for CRE companies with high exposure to office spaces. If businesses need reduced capacity for a partially teleworking workforce, this could lead to a mass exodus from one of CRE's biggest customers.
Similarly, many retail-focused CRE firms have been struggling for years thanks to the surge in e-commerce, which has hollowed out the traditional mall.
But not all CRE is created equal...
One example CRE firm that hasn't been disrupted is National Retail Properties (NNN). The company's largest tenants include convenience stores, automotive services, and fast-food restaurants. Think tenants like 7-Eleven, Mister Car Wash, Camping World, Taco Bell and Arby's franchises, and other convenience stores.
These types of businesses are less cyclical, meaning they thrive during all economic conditions. People always need to get a quick bite to eat, and cars always need repairs.
National Retail does have exposure to some gyms and movie theaters, like LA Fitness and AMC. And yet, the number of these leases is far less than the company's more recession-resistant ones.
This has allowed National Retail to weather the storm better than competitors.
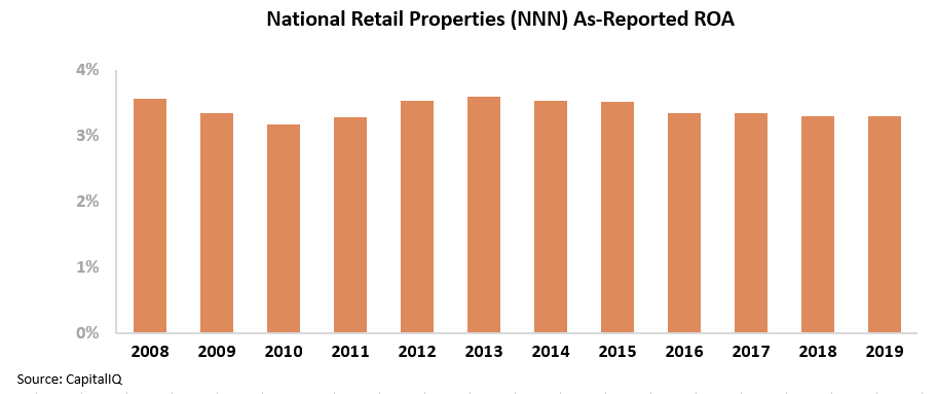
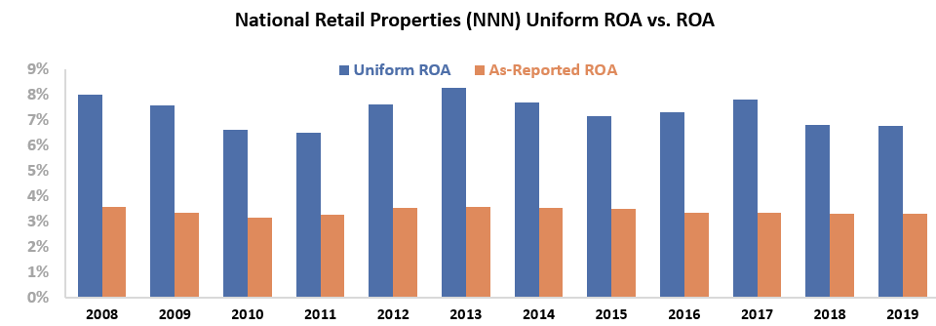
But investors looking at as-reported metrics would see a company with weak returns, even compared to peers in the low-return real estate industry. National Retail appears to be a business that has generated returns on assets ("ROAs") that are below the cost of capital.
However, this picture of National Retail's performance is inaccurate... It's propped up by the problems in as-reported accounting. Due to the GAAP treatment of depreciation and interest expense – among other distortions – the market has missed the mark on the company's success.
National Retail has managed to create a retail business capable of weathering economic downturns.
The company's Uniform ROA was in fact more than double the as-reported numbers from 2008 to 2019. As you can see, this metric has fluctuated between 7% and 8% over the same time frame. This includes the 2008 to 2009 recession, where National Retail maintained its strong returns thanks to the recession-resistant – and at times, counter-cyclical – nature of many of its tenants.
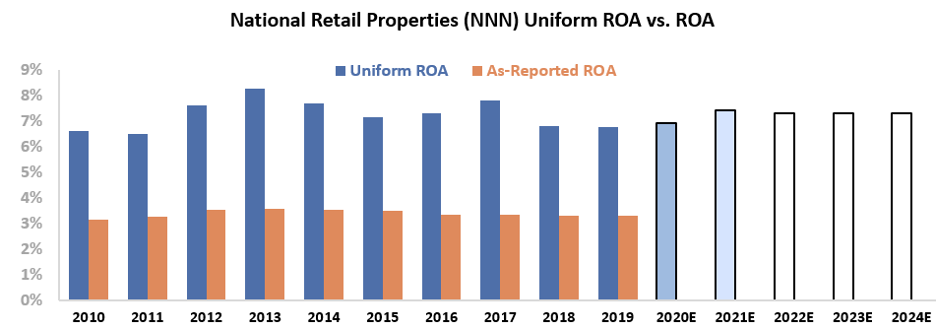
To understand what the market thinks about National Retail, we can use the Embedded Expectations Framework to easily understand valuations.
The chart below explains the company's historical corporate performance levels, in terms of ROA (dark blue bars) versus what sell-side analysts think the company is going to do in the next two years (light blue bars) and what the market is pricing in at current valuations (white bars).
As you can see, both analysts and the market expect National Retail returns to improve from current levels, thanks to the company's resiliency. This is different from what reasonable investors would expect for many other retail REITs.
Ultimately, Uniform Accounting shows the true strength of National Retail's business. The market recognizes this, though investors looking at as-reported data might not.
The company also sports a healthy 6% dividend, which it raised during the first quarter. That only further highlights what the Uniform Accounting data are saying... This is a much stronger business than as-reported metrics reflect. Without Uniform Accounting, investors would miss a dependable company amid market fears.
Regards,
Joel Litman
August 5, 2020