Financial models are only as good as the assumptions that drive them...
It's one of the first things we teach our MBA students.
If you forecast a company's revenue and profits and investments without an understanding of the factors that power those metrics, the financial model is as likely to be accurate as a blind person throwing darts across a bar.
Great investors build their models off of key performance indicators ("KPIs") for a company – what we also call "quantitative non-financial indicators." These are the non-financial metrics that actually fuel a company's profitability.
Retail store openings and closings, the number of treatments provided by a health care firm, or billable hours for a consultancy company are some examples of factors that investors can wrap their minds around. Most important, they're also the factors that actually drive a company's future growth, profitability, and investments.
Whenever we teach our students (and clients) about the importance of understanding KPIs, we often send them to one place: Trefis.
A group of MIT professors created this website to help investors visualize how different KPIs directly impact a company's valuation, based on how they affected future cash flows. Users can view different toggles on fundamental performance and see how these directly impact results and valuations.
Trefis is a powerful tool. As such, much of the site's technology has been pulled behind a paywall... but ample models are still available that illustrate the power of this type of framework.
Make sure to play with a few of the models if you get a chance. It can open your eyes to the importance of understanding the right factors behind a company's performance... and how these actually impact valuations.
There's more than one way to view most economic markers...
We're well aware of this here at Altimetry... where our office is often buzzing with economic banter.
While one of us may point out that U.S. Treasury rates near all-time lows could help support higher stock market valuations, someone else may highlight that this also means more investors are putting their money in "safe haven" assets – potentially a signal that the market is getting riskier.
In the December 23 Altimetry Daily Authority, we covered another contentious signal...
Specifically, we discussed consumer credit.
We explained that consumer credit default rates were near 15-year lows and that debt payments as a percentage of disposable income were at a 38-year low.
Not only are these signs that consumer debt markets look healthy, but they may also indicate that households have room to continue growing consumption. This is another driver of economic growth.
As we mentioned, though, consumer credit is a contentious marker. For instance, midway through 2019, U.S. consumer debt finally surpassed levels seen just prior to the Great Recession.
This is a worrisome signal to some economists, and it's clearly a topic most Americans are aware of. Most of the Democratic presidential candidates have spoken out against current debt levels.
One type of consumer debt in particular has been central to the conversation – student loans.
Outside of mortgages – which still represent nearly 70% of all U.S. consumer debt – student loans have ballooned to the second-largest category. They're now up to $1.5 trillion, or just more than 10% of all consumer debt.
Student loans surpassed both auto loans and credit-card debt over the past decade, and aren't showing many signs of slowing down.
Rising student debt is particularly concerning due to the potential to cause mass delinquencies down the line – reversing the recent trends we discussed in our December 23 piece.
However, by digging further into each kind of consumer credit, we can see whether or not this is likely...
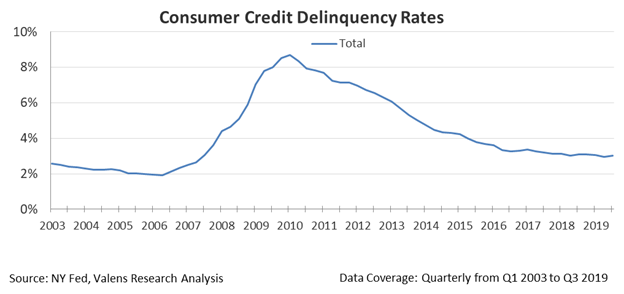
And one way we can do this is by looking at consumer delinquency rates – both overall and by category.
On a quarterly basis, the New York Federal Reserve releases data on "seriously delinquent" loans (90-plus days past due).
As you would expect, the overall delinquency rate tracks the overall default rate quite closely, with consumer delinquency rates still generally trending downward and remaining well below levels leading up to the Great Recession.
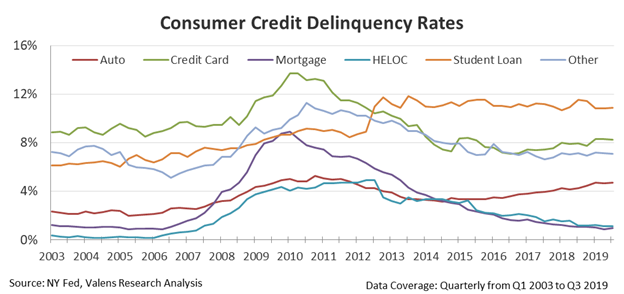
When we break each category out, we can understand why rates continue trending downward despite the massive rise of student loans.
The Great Recession was in large part onset by a mortgage default crisis, as mortgages have been the largest source of consumer debt in the U.S. since well before 2008.
As a result, it's no surprise that we saw a large rise in mortgage delinquency rates from 2007 through 2010. Take a look...
After peaking in mid-2010, mortgage and home equity line of credit ("HELOC") delinquency rates have steadily declined to levels near 1%.
Additionally, with the exception of student loans, all categories have flatter or lower delinquency rates than they did during the last recession.
While student loan delinquency rates – at levels near 11% – are now the highest of any category, they have actually remained stable since 2012. This is despite the fact that student debt has grown 50% – from $1 trillion to $1.5 trillion – over the same time frame.
As long as individual delinquency rates hold steady or continue declining as they have recently (despite higher overall delinquency rates), we see little reason to be concerned about the health of the market today... despite all the talk about student loans.
Regards,
Rob Spivey
February 10, 2020
P.S. Regular readers know we expect the market to continue higher... and we're not alone. Although our research style is different, we keep coming to the same conclusion as Stansberry Research's Dr. Steve Sjuggerud: This market still has room to run.
This Wednesday, February 12, Steve is hosting a free online event to discuss a huge shift in his bullish thesis. He'll also reveal one investment he believes could soar as much as 500% as this bull market continues. Joel and I will be tuning in... and we encourage all Altimetry readers to do so as well. You can learn more right here.