Market watchdogs' predictions are only as good as their data...
If you listen to the financial media, it would have you believe the market is about to crater. The reason why? As-reported profit margin forecasts aren't rising anymore.
According to this school of thought, as Bloomberg recently highlighted, when analyst estimates for as-reported profit margins stop rising, investors should brace themselves for severe market drops. According to Bloomberg, this could have predicted the 2011, 2015, 2018, and 2020 market drops.
Since margins are already sitting at all-time highs and analyst estimates aren't rising, the market must have nowhere to go but down. The bears are saying to take your money and run, folks!
If the buck stopped with as-reported metrics, the concern would be understandable. But as regular readers know, here at Altimetry, we have better data to look at.
Uniform Accounting shows a much more accurate representation of actual economic conditions not just for companies, but also for the economy as a whole.
So let's figure out what exactly is going on, and if you should be concerned...
As we highlighted in the August 9 Altimetry Daily Authority, a deeper, longer-term look at real corporate profits shows that the current market isn't some aberration... Nor is it unsustainable.
It's true that companies are performing at the top of their historical range, but this is part of a long-term, secular trend in corporate profitability.
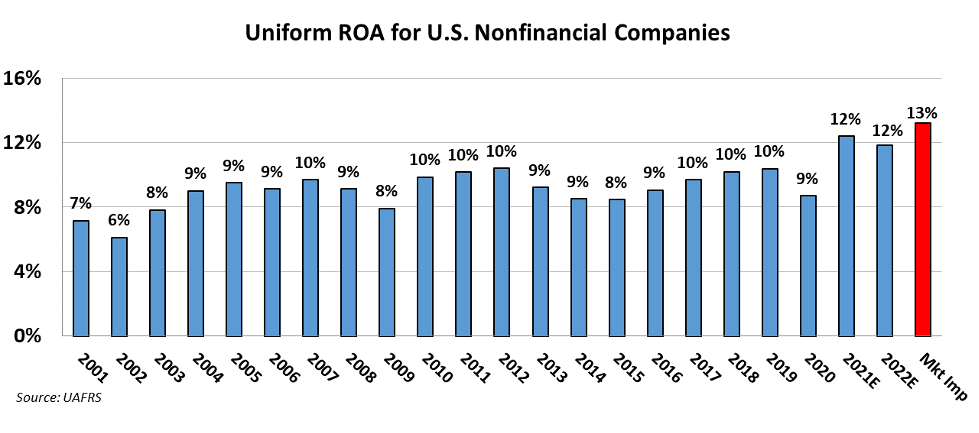
We've seen a steady secular move upward in Uniform returns on assets ("ROAs"). Corporate profitability has consistently reached higher highs, and higher lows, through cycles.
As U.S. corporations have moved away from lower-return manufacturing businesses and into higher-return intellectual property ("IP") based businesses, they've also become more focused on operating efficiencies. Quality and efficiency regimes like "Lean" and "Six Sigma" have permeated the entire corporate world – boosting aggregate ROAs.
Companies have also gotten smarter about limiting investments when they can't find growth opportunities. That has come with significant new modeling and forecasting capabilities made available by easily accessible Big Data.
With the right data, the movement of the benchmark S&P 500 Index over the past 20 years makes more sense.
After dropping in 2001 and 2002, Uniform ROA levels reached 10% in 2006 and 2007. These levels exceeded the levels of 1999 and 2000, just as the market was making new all-time highs.
Then after dropping in 2008 and 2009, Uniform ROA again reached new peaks in 2011 and 2012. By early 2013, the market was making new all-time highs.
After falling due to energy-market headwinds from 2013 to 2015, markets were on the way to new highs before the coronavirus pandemic threw a wrench in the supply chain. This is part of the reason why the stock market recovery was so robust.
Said otherwise, companies aren't teetering at the top of a business cycle. Take a look...
Although negative cycles cropped up in 2000, 2008, 2015, and 2020, they weren't driven by cyclical profitability trends... but rather by credit crunches interrupting the profit cycle. This is the other part of why in 2020, when the trough was driven by forced economic closures to fight the pandemic and credit was open, the stock market rebounded so quickly.
This understanding of the credit cycle gives context to our position in the profit cycle. So long as capital remains free-flowing, companies maintain plentiful cash buffers to service their obligations, and interest rates remain stable... a hot economy alone is no reason to panic. It can actually be a sign that the economy is strong and will remain so for the foreseeable future.
And although analysts predict a minor contraction in 2022 Uniform ROA, there's no need to worry so long as credit markets stay healthy. Corporate productivity will still be higher than it has ever been pre-pandemic.
Even when looking at market expectations, we see a reasonable picture. Based on current valuations, the market expects Uniform ROAs to expand to 13% in 2024. While this may prevent investors from reliving the surprise big gains of 2020 and the first half of 2021, there's no reason to believe that cash stashed on the sidelines will perform better than stocks.
So where does this leave us?
There is no example from the past 100 years where a healthy market has collapsed absent a credit crunch or some other black swan event.
That's why, as we highlighted in this month's big-picture Timetable Investor update to our Altimeter subscribers, we continue to recommend investors stay bullish – subscribers can read it right here.
If you aren't an Altimeter subscribe, find out how to get the full story and get a complete view of our Timetable Investor feature by clicking here.
Regards,
Joel Litman
September 27, 2021