Anthropic could become one of the biggest stock debuts in history...
On Tuesday, the AI lab behind the Claude chatbot kicked off its IPO roadshow. That's the stretch when a company pitches big investors on its shares before they start trading publicly. Anthropic is asking $70 to $78 per share.
At the top of that range, Anthropic would raise about $64.4 billion and be worth roughly $1.4 trillion. That would trail only Elon Musk's SpaceX (SPCX), which raised $86.2 billion in its record IPO in June.
While $1.4 billion is a big number, some folks expected more for Anthropic. Just weeks ago, reports floated a $2 trillion valuation.
But since then, AI stocks have taken a beating. Democrats' gains in last week's midterm election sparked fears of tougher rules on the data centers powering AI.
Still, Anthropic is pushing ahead. Its shares are expected to start trading on November 19.
So investors are split... Some think this debut will mark the peak of the AI boom. Others think it will kick off the next leg higher.
But before you pick a side, you should see what the stock market's headline numbers are hiding right now...
Look past the S&P 500 Index, and most of the market is rising...
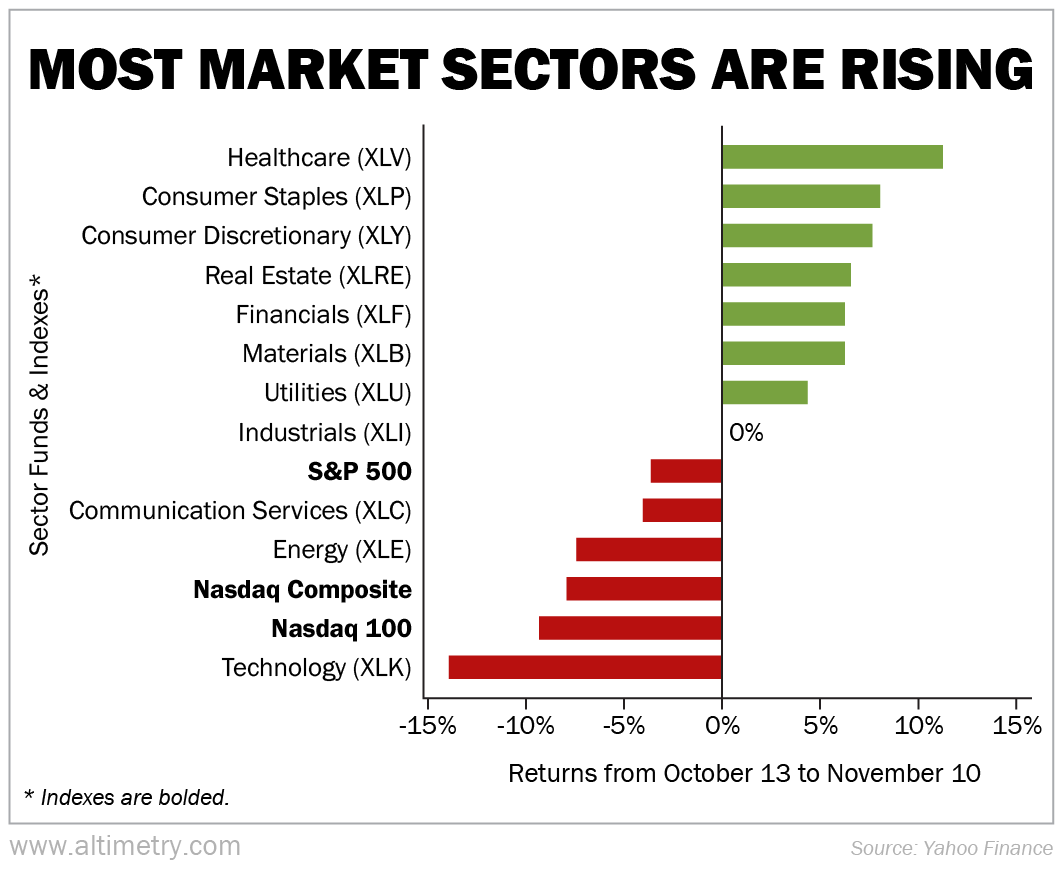
Since mid-October, the S&P 500 is down nearly 4%. The tech-heavy Nasdaq 100 Index fared even worse... falling more than 9%.
Tech stocks took the worst of the damage. The State Street Technology Select Sector SPDR Fund (XLK), which tracks the S&P 500's tech sector, has dropped 14%.
If you only paid attention to those numbers, you'd think investors were running for the exits. But if you looked a bit closer, you'd see that of the S&P 500's 11 major sectors, most of them were actually up. (You can see that through each sector's tracking fund.)
Healthcare stocks have climbed 11%. Consumer staples (companies that sell everyday goods like groceries and toothpaste) are up 8%. Financials, materials, real estate, and consumer discretionary (nonessentials like cars and vacations) have each gained between 6% and 8%.
In all, seven of the 11 sectors have risen despite the broad index's overall decline. Take a look...
The index is flashing red. But most of the sectors inside it are green.
The reason comes down to how the index is built. The S&P 500 weights each company by its total market value. The bigger the company, the more it moves the index. And today, tech makes up nearly 40% of the S&P 500's value.
So when tech drops 14%, that alone drags the whole index down about 5 percentage points, even while most other stocks climb. If every company counted equally, the S&P 500 would be up about 4% since mid-October.
Don't let one number decide whether you're scared or confident...
The headline index says the market is in trouble. But the selling is packed into one corner of it. Elsewhere, money is flowing in.
That's easy to miss in a choppy market like this one. And when the headline index is your only gauge, it's easy to make the wrong call.
Even when the headlines turn ugly, money is working somewhere. You just need a way to find it.
That's why I recently sat down with our friend Brett Eversole, a 16-year veteran of our corporate affiliate Stansberry Research, to build a framework for exactly this kind of market.
Together, we combined our research to identify a rare group of stocks called "Perfect Breakouts." The presentation goes live next Thursday, November 19 – click here to reserve a spot.
In the meantime, before you sell because the S&P 500 is falling, check how the sectors you own are doing.
Regards,
Joel Litman
November 12, 2026