We're always looking for macroeconomic outliers...
We spend some time digging through the S&P 500 website every month.
The site has all kinds of useful data about the biggest companies in the U.S., making it a great resource to start our Uniform Accounting analysis that goes into our Timetable Investor report.
The S&P 500 website includes an earnings forecast Excel sheet with a bounty of information. When we look to do our Uniform analysis of the economy as a whole, we need to look at as-reported data. From there, we know where to make adjustments to understand the risk of another recession.
The data also shows what the market is thinking about earnings growth and valuations, and we can look at metrics like earnings beat and miss rates and analyst estimate trends as well.
Considering that the S&P 500 makes up the vast majority of the U.S. stock market by capitalization and a sizable chunk of the global market cap, you'd be missing important market insights if you weren't paying attention to this data...
There's something different about the data this month...
As our Timetable Investor subscribers read a week and a half ago, a concerning data point stood out.
While most pundits reporting during earnings season are laser-focused on certain company earnings, we noticed a larger picture – that revenue estimates bucked a decadelong trend.
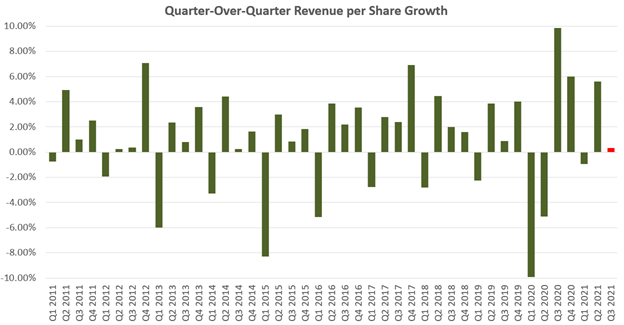
Let's look back over the past 10 years. The quarter-on-quarter revenue growth rate has followed a standard pattern, trending up over time.
The only exception is during the first quarter of each year, which always faces a difficult comparison with the fourth quarter because the holiday season is typically the strongest revenue period for the U.S. economy.
Take a look at the quarter-on-quarter revenue growth trend...
Before isolating the weak first two quarters, this third quarter doesn't necessarily seem to be out of the ordinary.
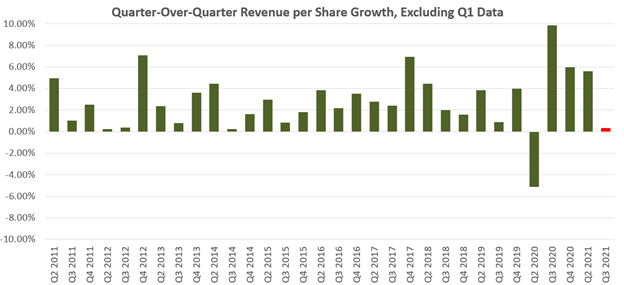
However, once we remove the first-quarter data from the chart, this quarter's revenue results shine through as exceptionally weak.
Third-quarter revenue growth, measured quarter over quarter for the past 10 years, typically ranges between 0.25% and 2.41%.
Until last week's data came in, the third quarter was expected to have negative earnings growth. That hasn't happened in more than a decade.
As quarterly results continue trickling in, it appears that revenue growth this quarter will sit at the bottom of the 10-year range, at 32 basis points. This excludes the revenue shrinkage during the second quarter of 2020 when the economy shut down to contend with the coronavirus pandemic.
Weak sales growth is a powerful signal amid the current period of positive economic growth...
It highlights what we call the "growth hangover," caused by the explosive large-cap performance from last year.
Regular Altimetry Daily Authority readers shouldn't be surprised by the lack of growth.
In early October, we highlighted that our Management Confidence Index had taken a sudden nosedive, suggesting that management teams had changed their bullish tune to one of concern.
Moreover, we've been covering the supply chain disruptions that make it more difficult than ever for companies to do business. Companies are hesitant to invest in long-term growth amid the uncertainty and their often-expensive attempts to secure short-term supply.
Because of this, we still expect to see a sideways market in the near term...
But that doesn't mean all stocks will move sideways. In fact, we just identified a microcap stock we think could turn into a 10-bagger in our Microcap Confidential service.
I recently shared my thesis on this stock – including the name and ticker symbol – in a presentation on stage at our sister company Stansberry Research's annual conference in Las Vegas.
For the next few days, I've "unlocked" the presentation for you to watch, no e-mail address or credit card required. You can view it right here.
Regards,
Joel Litman
November 8, 2021