The S&P 500 Index is near all-time highs...
Most people would consider that a good thing. It's a sign of growth and prosperity.
But investors are a different breed, and they tend to be more skeptical of good news. While this bull market has continued on for more than a decade, we often see investors begin to worry every time the markets reach all-time highs.
It's an understandable reaction, emotionally speaking. The path upwards is unprecedented, but we've seen many markets fall after an all-time high. Just recently, Fortune put out an article titled "The downside of a stellar 2019? Stocks are now shockingly expensive by nearly every measure."
However, the level the market is trading at tends to be far less important than the valuations...
We often talk about the price-to-earnings (P/E) ratio as a reliable valuation metric (when it's calculated using Uniform Accounting). Even still, we see clients debating between using different variations of the ratio – like a trailing P/E ratio (based on the past 12 months of earnings) versus a forward P/E ratio (the projected earnings for the next 12 months) – and what that means for valuation levels.
In the December 16 Altimetry Daily Authority essay about inflation, we briefly discussed why we prefer to look at the forward P/E ratio... and we looked at valuations for the market as a whole.
Right now, the market is trading at a P/E ratio of 21.7 on a Uniform basis, which is in line with long-term averages. Stocks aren't "shockingly expensive" when you look at the right, Uniform data points.
Hopefully, this can serve as a friendly reminder that it's important to consider all the facts when looking at the markets... beyond what you see in the headlines.
One of the most famous economists of all time coined an interesting term...
John Maynard Keynes was a prominent British economist whose ideas permeated policy decisions in most developed economies throughout the mid-20th century. He's credited as the inventor of the term "animal spirits" as it's used in the financial markets today.
While not clear from the name, the phrase is commonly used in financial publications and media outlets to describe a type of economic sentiment.
In Keynes' 1936 book, The General Theory of Employment, Interest, and Money, he states that due to human nature, investors can reach a state of economic "euphoria" where emotion dictates decision-making instead of logic.
This is a result of "animal spirits" – an urge to act, rather than to be left out, when it seems that nothing can go wrong.
This is the same phenomenon that leads to emotional investors buying at a market peak during euphoria and selling at a market low during a period of fear.
When reporters for CNBC or other financial media outlets use the term "animal spirits," they mean there's a level of excitement from investors... which can often mean we're close to a market top.
Nobody wants to be left out of a bull market, so we often see high levels of investment just before a market crash. We can measure this several ways – including equity market inflows and outflows, technical analysis, and deal activity.
Deal activity is a great indicator of animal spirits, as companies begin bidding for deals they otherwise might not. Executives start to feel as though they must participate in mergers and acquisitions ("M&A") or they'll be left behind.
We reliably see rising M&A values track overall sentiment in part because more deals are getting done, but also because companies are at their most expensive valuations. Additionally, it's a signal that management teams are seeking to put capital to use while they're unable to find organic growth opportunities.
A large spike in M&A value – particularly private-equity-driven M&A value – is a strong sign that we're approaching the 11th hour of a bull market.
We've seen numerous articles over the past year indicating that private-equity firms are sitting on more cash – often called "dry powder" – than ever before. This is a potential indicator that the current market isn't being driven by animal spirits, but it will be helpful to look back at global M&A history to put this into context.
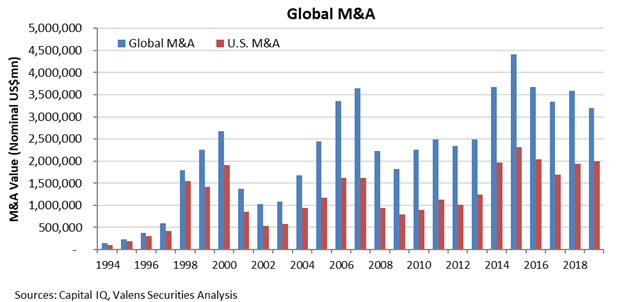
Take a look at the chart below. It highlights global M&A trends in terms of total deal value over the past 25 years...
As you can see, we saw a significant acceleration of global and U.S. M&A value leading up to both 2000 (the dot-com bubble) and 2007 (the Great Recession) caused in part by animal spirits.
Interestingly, we saw a similar trend in 2015 without any other key indicators, and M&A levels have more or less stabilized since then.
Looking at the past three years, U.S. M&A value has only modestly increased while global M&A value has actually fallen, with both values comfortably below 2015 levels.
In terms of deal volume, 2007 was the highest year ever – with just over 2,800 deals globally. This was significantly higher than 2005 and 2006... which had just over 1,700 and just under 2,300, respectively. Deal volumes have never come close to 2007 levels since then, stabilizing in the 2,100 to 2,300 range over the past five years.
In fact, most of the deals in the past year were strategic acquisitions as opposed to private-equity buyouts. As the Wall Street Journal noted in a recent article, U.S. private-equity firms are about to reach a record $800 billion in dry powder. Private-equity deal volume was also on track to be lower in 2019 when compared with prior years, as of the third quarter of 2019.
These all indicate that most deals are still logic-driven... and that management teams and private-equity firms haven't succumbed to animal spirits.
At current levels, based on this data, there's little reason for concern that we're approaching a market top. We would need to see deal value begin accelerating – combined with all the other indicators we often discuss in Altimetry Daily Authority – before beginning to think that we're in the final stage of the current bull market.
Regards,
Joel Litman
January 27, 2020