McDonald's (MCD) offers a window into how bad things actually are...
The fast-food giant released March same-store sales last week. When the numbers came out, I took a quick straw poll of the office on Google Hangouts to see if anyone could guess how much they fell compared to March 2019.
The average guess was a decline of 80%.
Our team, looking at all the news that's currently out there, figured sales must be down by a significant amount. And I consider them all to be fairly well informed.
But they were all way off...
Same-store sales at McDonald's fell just 22% globally from the prior year period. And they fell just 13% in the U.S.
Those obviously aren't great numbers, but our team assumed things were 4 times worse for the company than what actually happened.
In the March 17 Altimetry Daily Authority, we mentioned the idea of capitulating to emotions. Even the most rational people can succumb to this, and all of the negative headlines have pushed even the most stout bulls to become more pessimistic. We're at the stage in this market where even my well-informed colleagues think the economy has come to a complete stop.
After all, when asset-management firm Blackstone (BX) CEO Steve Schwarzman says we've lost $5 trillion of gross domestic product ("GDP") – almost 25% of the annual GDP – their estimates "felt" about right.
Now, it's clear that things aren't healthy in the U.S. or across the globe, and this one anecdote isn't proof that everything is alright. McDonald's makes more than 70% of its revenue through delivery and the drive-thru, and 99% of its stores are still open in the U.S., so it may be better-positioned than other restaurants.
But this is a reason for us to pause and evaluate our outlook. And we should consider whether some of the more pessimistic declarations about the economic outlook are based on reason... or on emotion.
It's time to revisit a valuable recession indicator...
In one of our first macro essays back in September, we took a look at the credit default swap ("CDS") market to see if investors were overly concerned about corporate credit.
As a reminder, a CDS is a contract that acts like insurance for a bond. For a small fee, investors can purchase CDSs to remove the risk that they won't be paid.
The CDS market is highly liquid, with trillions of dollars in outstanding contracts today. This is an active, well-functioning market, so it's an accurate proxy for corporate risk.
As we said in September, corporate borrowing costs had been declining steadily from their peaks in late 2018. In fact, we saw positive trends in all three "buckets" of companies – investment grade ("IG"), crossover ("XO"), and high yield ("HY") – where each bucket is considered risker than the last.
You probably won't be surprised to find out that over the past month or two, we've seen a major shift in perceived market risk...
March featured two of the 10 largest single-day market drops in history as the coronavirus pandemic caused large parts of our economy to screech to nearly a halt.
And the U.S. Federal Reserve has been doing everything it can to offset this fear and volatility. It dropped the federal funds rate from 1.75% just a few months ago to levels near zero today, and it has injected large amounts of capital into the market with its own buying activity.
All of this has helped maintain liquidity in the hope of keeping borrowing costs relatively low.
You see, federal interest rates are a component of every company's borrow costs – often referred to as the risk-free rate ("RFR"). By adding the RFR to each bucket's average CDS cost, we can understand the actual perceived market risk relative to history.
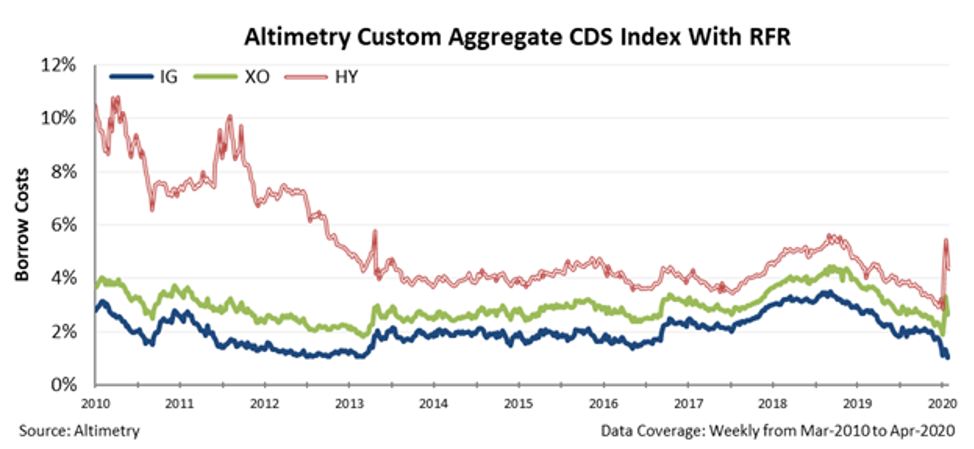
The chart below highlights CDS prices with the RFR over the past decade, separated by the three risk buckets: IG, XO, and HY. IG companies are typically large, stable businesses... while HY firms are the smallest and riskiest. XO companies fall somewhere in the middle.
In the midst of the panic, the cost to borrow for higher-risk U.S. corporates shot up significantly. For HY names, this jumped to levels seen in late 2018, when the market was concerned about slowing growth and recessionary risk for the U.S. and world. Take a look...
This caused many people to cry out with concerns about credit issues emerging, just like we saw back in 2008.
But as the chart shows, even after that rise higher, the cost to borrow for HY companies was significantly below levels heading into, during, or right after the Great Recession.
More important, this initial panic has already started to moderate. The cost to borrow for HY companies is back down to where it was during the more normal credit environment from 2014 through 2017.
We've said it repeatedly... while we're clearly being forced into a short-term recession by the actions the world has taken to slow the spread of coronavirus, credit markets are signaling that companies aren't at risk of the widespread defaults that could make a health crisis turn into a credit crisis.
This means that this short-term dip is unlikely to turn into a prolonged recession or a protracted bear market.
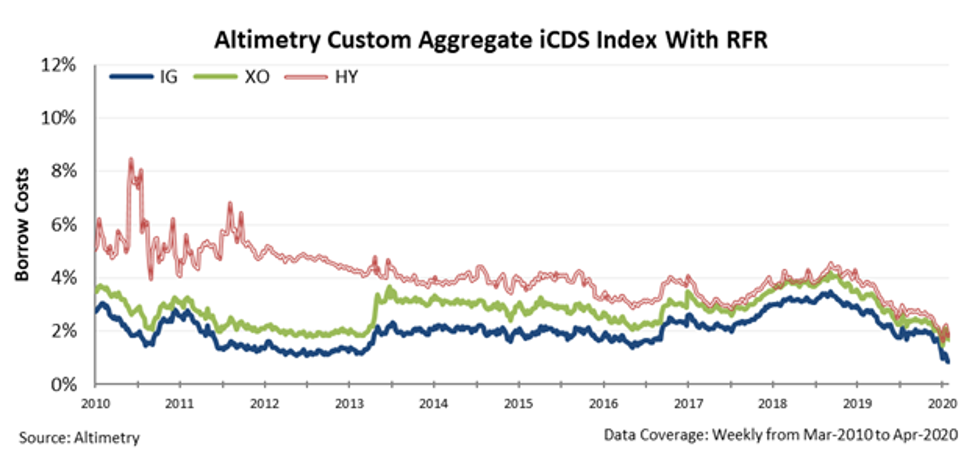
That said, there's even more to the story... Once we apply our Uniform Accounting metrics, we can see through the "noise" created by distortions in as-reported financial metrics that can make traditional CDSs diverge from reality.
We call this Uniform version "Intrinsic CDS," or "iCDS." In reality, borrowing costs – and therefore credit risk – remain even lower than typical CDSs might have you believe.
While CDS spreads have expanded over the past month from almost all-time low levels, they are still comfortably below 2018 highs...
With the RFR falling more than 1.5% since the beginning of the year, the total cost to borrow has almost remained flat from just a few quarters earlier. Even though spreads are starting to rise, their starting points were near historic lows.
At these levels, it's not the time to panic about the credit markets. We'll continue to monitor CDSs and iCDSs in the coming weeks and months... stay tuned.
Regards,
Joel Litman
April 13, 2020