Yet another platform business is struggling to find profitability...
We've talked a lot about platform companies this week in Altimetry Daily Authority. On Tuesday, we highlighted food-delivery business Grubhub (GRUB)... and yesterday we talked about ride-hailing service Uber's (UBER) struggles.
In recent years, another transportation-marketplace fad emerged... the on-demand scooter and bike industry. The only difference was that the platform wasn't actually a platform.
In the scooter startup world, the marketplace actually had to invest in the scooters – meaning more capital was tied up than in the platforms like Uber, where its contract drivers own their own cars.
And just like Uber and Lyft (LYFT), these "next-generation mobility companies" – as they call themselves – haven't been spared in the struggle to achieve profitability.
Just last week, scooter-sharing business Lime announced it would pull back on growth to try to start actually generating a profit for their investors... What a novel idea! The company announced it would leave 12 cities and let go of 100 employees in an effort to reach profitability.
It's just another example of how the platform business model Silicon Valley has been pushing over the last few years – running at a loss to get massive market share and then converting to a profit – hasn't worked. It's just another version of the old adage, "we lose money on every sale, but make it up in volume."
In recent years, we've seen an increasing number of completely fabricated 'sales holidays'...
If you've ever wondered where Black Friday got its name, you've probably come across the theory that it relates to the point in the year where retailers start to make a profit.
It's an intuitive story. Retailer margins are relatively thin, so it makes sense that they only really flip to a profit late in the year. Only on Black Friday did their income statements go from being "in the red" to "in the black."
As great as the story is, it's questionable. Retailers didn't like the original story, so in the early 1980s, the new narrative was pushed to try to change the context of Black Friday.
For those who have spent time researching the phenomenon, most agree that the origin of the phrase actually emerged in the 1950s, for two different reasons...
Factory managers would term the Friday after Thanksgiving as "Black Friday" because the factories were basically closed, since so many workers would call in sick to get a four-day weekend with the holiday.
Also, police in the Northeast – particularly in Philadelphia and Rochester – called the day "Black Friday" because of the mess of crowds and traffic that occurred every year with the start of Christmas shopping.
It was especially true in Philadelphia... Everyone came in from town to shop on Friday, ahead of attending the Army-Navy football game held the Saturday after Thanksgiving.
While Black Friday has been around for decades, it wasn't until roughly the past 15 years when stores began opening before sunrise to find hundreds of customers already lined up.
Not only that, Black Friday has transformed into an entire week of events, starting with "pre-Black Friday" deals in the days leading up to Thanksgiving and concluding with its online counterpart, Cyber Monday.
With the rapid rise of e-commerce, sales days are no longer limited to a day most people have off from work.
In fact, certain companies – most notably Amazon (AMZN) – have created their own sales days. In 2015, to celebrate its 20th anniversary, Amazon unveiled "Prime Day" – a site-wide sale claiming to have better deals than Black Friday.
Fast-forward to 2019... and Amazon alone has managed to catch up to Black Friday in terms of sales figures. The company's 2019 Prime Day (which lasted 48 hours) generated $7.2 billion in sales, which is roughly the same figure Black Friday saw just a few months later in digital sales.
That's a staggering number – one company matched the digital sales of a national holiday dedicated to shopping.
That said, it's far from the biggest sales day of the year... That honor goes to a Chinese holiday which dwarfs both Prime Day and Black Friday.
Singles Day was created to rival Valentine's Day, and dates back to 1993 as a celebration of being single. Rather than shopping for a significant other, the point is to "treat yourself." Funny enough, the "holiday" is celebrated on November 11 because of all the lonely "1s."
Chinese e-commerce giant Alibaba (BABA) has made Singles Day the largest online-shopping day in the world by a large margin. Last year, the company generated a staggering $38 billion in sales on its platform in just 24 hours.
That's more than twice Prime Day's 48-hour sales window and all of Black Friday's digital sales combined.
However, despite having institutionalized Singles Day and continually breaking its own revenue records year-over-year for the event, Alibaba's returns have come under pressure in recent years...
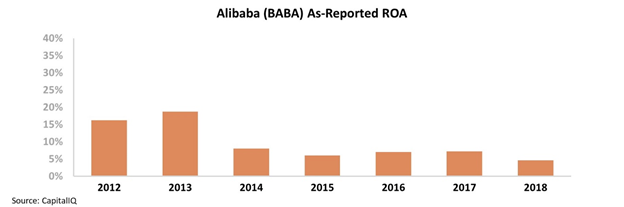
After generating fairly strong 16% to 19% returns prior to its initial public offering ("IPO") in 2014, Alibaba has since struggled. Over the past five years, its as-reported return on assets ("ROA") has slid from 8% to just 5% in 2018 – putting the company firmly below corporate-average levels. Take a look...
A pattern of returns like this signals that Alibaba's massive growth investments have likely been too aggressive, resulting in ROA compression. This seems puzzling for a company that has built arguably the strongest e-commerce presence in the world, along with several other successful business lines.
Like Amazon, Alibaba has moved into cloud computing, entertainment, and Internet services. Alibaba also owns 33% of the most valuable "unicorn" company in the world, Ant Financial (formerly known as Alipay).
With all of these successful, high-growth business lines, it's surprising that Alibaba fails to generate above-average returns. But if you take a closer look, the issue isn't with the company's operations... but rather with its financial statements.
As-reported accounting features a number of misleading practices that make it difficult to accurately measure financial performance.
This is why we use Uniform Accounting – which adjusts for as-reported accounting inconsistencies like the treatment of goodwill, non-cash stock option expenses, and excess cash. These distortions make Alibaba look like a much weaker business than it really is.
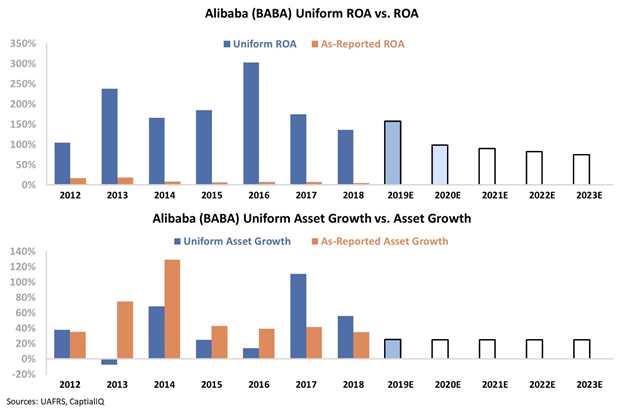
The chart below shows Alibaba's historical corporate performance levels in terms of ROA and asset growth (dark blue bars) versus what sell-side analysts think the company is going to do over the next two years (light blue bars) and what the market is pricing in at current valuations (white bars). Just look at the massive discrepancies...
Despite its weak as-reported results, in reality, Alibaba has maintained a 100%-plus ROA since 2012. Not only is the company far more profitable than traditional metrics would indicate, but it has been able to maintain this level of returns while substantially growing the business.
Since 2012, Alibaba has grown its assets by an average of 44%, and it has grown by more than 50% in each of the last two years.
Despite this, the market has only modest expectations relative to Alibaba's actual performance. It's projecting Alibaba to maintain 25% growth while seeing its ROA fade to historically low 75% levels over the next several years.
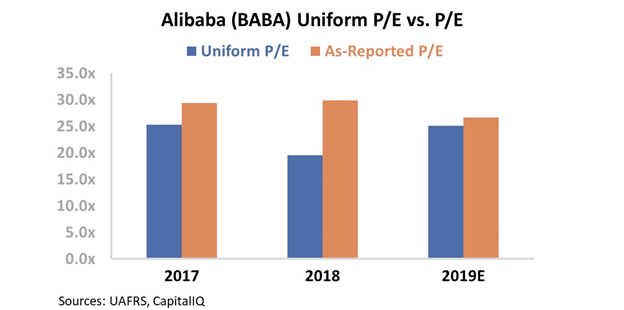
This is reflected in the company's valuations, too. While Alibaba's price-to-earnings (P/E) ratio is slightly above the market average of 20 times, a P/E ratio of 25 is quite low considering the company's continued growth potential.
At current valuations, Alibaba could easily surprise investors if it's able to maintain recent growth rates and profitability levels... but you wouldn't know it if you were looking at the as-reported figures.
Regards,
Joel Litman
January 16, 2020