A new set of numbers highlight who's losing the commercial airline war...
Reuters reported last week that Airbus won the volume war with Boeing (BA) last year for the first time since 2011.
While Airbus has repeatedly beaten Boeing in terms of orders since 2011, Airbus delivered 863 aircraft in 2019, versus 806 for Boeing.
As we've said repeatedly in Altimetry Daily Authority – including on December 20 and December 31 – Boeing is under more pressure than the market may understand.... and this is yet another sign of the plane maker's issues.
During the Great Recession, I worked for hedge fund Abernathy...
As the markets collapsed, we pivoted from mostly equity-only investing to diversifying into bonds in the fourth quarter of 2008.
If you were paying attention to the data, it was hard not to want to wade into the credit markets. There were so many bonds offering equity-like returns and trading at a significant discount to par value.
And as long as the world didn't end, many of them were going to be "money good" – with fat coupons and capital appreciation. It's a savvy investor's dream.
Coming from an equity background, we generally valued assets based on cash flows and earning power – much like here at Altimetry when we talk about Uniform return on assets ("ROA").
But to identify which companies had bonds that would be money good – or which companies could refinance their debt – we needed to start to think like creditors do.
If you ask a creditor, there are two primary forms of lending to extend credit to individuals or institutions...
The first, similar to how most equity investors think, is cash-flow-based lending.
When a bank looks at a corporation or an individual's ability to take on debt, it often examines annual cash flow.
For an individual, this means banks are looking at your income and expenses as a benchmark for how much debt you can take on.
The same logic applies for corporations. A bank will project a company's cash flows as a way of determining how much debt it's willing to lend. Typically, banks will assign a "coverage ratio" – usually measured by how many "times" a company can service its debt obligations with its cash flows.
There are different types of coverage ratios, but one of the most common is the interest coverage ratio, which is the multiple of a company's earnings before interest, taxes, depreciation, and amortization ("EBITDA") to its annual interest expense.
We've written about this topic before – specifically highlighting aggregate corporate cash flows compared to aggregate debt. It can be useful to measure aggregate coverage ratios as a proxy for how much leverage is in the economy.
The other main type of lending is asset-based lending. Rather than looking at cash flows as a proxy for debt capacity, banks and other lenders can also look at a company or an individual's asset base as a way to lend debt.
For an individual, this form of lending is more common than you might imagine. Mortgages and auto loans are forms of asset-based lending – if you default on your loan payments, the bank simply takes the car or the house as repayment. The reason the interest rate on the loan is lower than it is on credit cards is because it is asset-backed.
The same principle applies to corporate asset-based lending. During the height of the financial crisis, MGM Resorts (MGM) had no cash flow to speak of, and it was desperate to refinance its upcoming debt maturities.
While no bank would be able to justify a cash-flow-based loan for the company, MGM was able to leverage its huge collection of Las Vegas assets as collateral to refinance in the heart of the credit seizure.
Similar to MGM, it's important to look at how much debt capacity the economy has in case companies are unable to maintain cash flows.
Across all businesses, an asset that can provide a good benchmark at any given time is cash on hand.
Looking at corporate cash (not to be confused with cash flow) compared with upcoming debt maturities is a good indicator of how strong of a liquidity buffer the economy has.
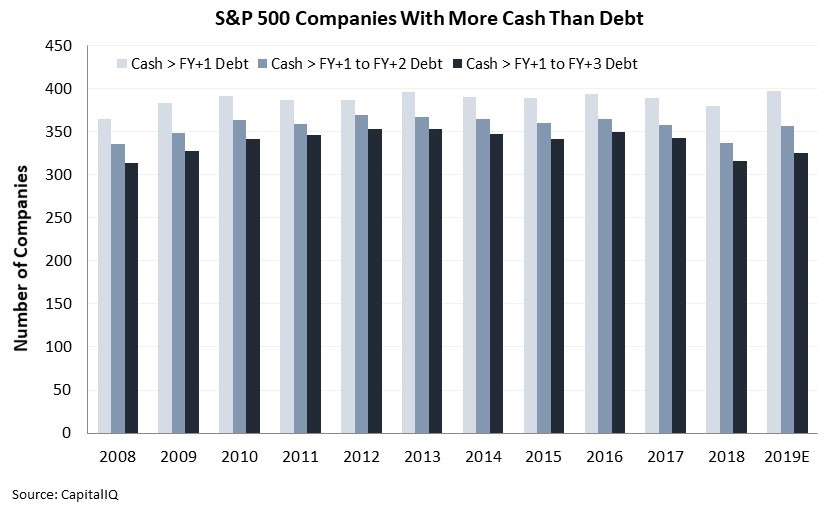
The below chart highlights the number of companies in the S&P 500 Index with cash on hand greater than their debt obligations for the next one, two, and three fiscal years. Take a look...
In 2018, cash relative to debt reached its lowest level in more than a decade. This might be driven by a few reasons, but it generally means the economy had less liquidity in 2018 than in previous years.
While not ideal, overall liquidity levels remained high. And in 2019, near-term liquidity is projected to reach a 10-year high. This is a reversal from 2018, as companies have begun to refinance their debt and build cash buffers – extending their maturities and improving short-term liquidity.
This is true for both debt coming due within a year and within two years, where the trend has also reversed. Given that roughly 70% of S&P companies are expected to have more cash than debt for fiscal year 2019 and fiscal year 2020, liquidity remains high in the economy.
As we've mentioned before in Altimetry Daily Authority, a recession and a deep bear market just do not occur without credit destruction. Even before we worry about the cash-flow strength of businesses, the cash liquidity that companies have to handle their obligations limits the risk of a credit crunch.
This is yet another signal that a recession doesn't look likely in the short term... and we'll continue to monitor these types of signals in the new year.
Regards,
Rob Spivey
January 6, 2020