Here's what the alphabet has to do with economic recovery...
Earlier this month, financial-services company Northern Trust put together a piece about the shape of the recovery after the coronavirus pandemic. Over the past few months, experts have debated how a recovery will play out in the U.S.
Some believe that due to government relief programs, the recovery would be "V shaped" – as the previous dip will revert, and the stock market would continue to rise. Others believe that the chart would resemble a "U," with a longer period of recovery due to a second wave of infections.
On the other hand, Northern Trust believes the recovery will resemble a "W." As the economy has swiftly made back previous losses before second-quarter earnings, the first half of the W has already occurred.
Due to the possibility of a second wave of the virus, Northern Trust believes that another large market dip is approaching. As Joel wrote in Forbes back in May, Wall Street has closed its eyes to the effect of the pandemic on second-quarter earnings... thus raising the possibility of a second correction.
However, using letters to describe market patterns is limiting. While the market may take a dip as investors come to terms with how badly the pandemic hit not just individuals and the economy, but thrashed corporate America's earnings... that doesn't need to mean the economy is going to take another leg down.
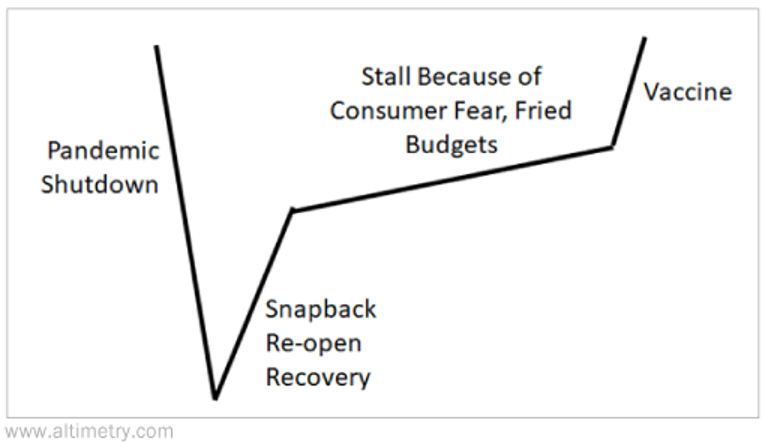
Here at Altimetry, we've started thinking about the post-pandemic recovery as something equivalent to how a riverbed looks downriver from a dam or a waterfall...
The river running over the dam drops dramatically, equivalent to the pandemic shutdown's effect on the economy. When the dropping water hits the riverbed, this creates extra erosion... and the water gets exceptionally deep.
Then directly after that dip, there's a sharp snapback in the level of the riverbed after the turbulence and eddies subside, but there's still more rapid moving water and erosion.
This is the snapback economic recovery we're seeing right now, as people become more comfortable venturing out and the economy reopens.
Then comes the normalization of the riverbed again. Waters are still turbulent – leading to higher erosion than normal – but as they calm... the riverbed starts to steadily become shallower. But it doesn't happen quickly – the slope slows dramatically from the initial snapback recovery.
For the next few months (or even quarters), this is what we're likely headed for in the U.S. Due to the inconsistent messaging about social distancing regulations, mask wearing, and how dangerous the virus is – as well as the issue of continued high unemployment – there's a decent subset of the populace and the economy that isn't going to return to normal as quickly.
There's too much fear and uncertainty for some people, and too many folks who are still unemployed. Workers in the service industry can't return to their jobs if there isn't sufficient demand for them to return.
This is worrisome for investors, because it's not what the market is pricing in right now. As we said in the July 6 Altimetry Daily Authority, the market is pricing in that V-shaped recovery based on current valuations. Even with the liquidity sloshing around the financial system, once investors come to terms with this – potentially while also coming to terms with ugly second-quarter earnings – it could lead to downside ahead.
Until consumers have some confidence to go back out as a whole and people across the entire economy can fully get back to work, we won't see the sharp recovery continue.
We aren't pinning all our hopes for a global health outcome on the timing of a vaccine... There are too many uncertainties in terms of how well a vaccine can boost immunity, the potential side effects, and the scale of how many people will actually get vaccinated.
However, from a behavioral economics perspective, reaching the point where anyone can easily get a vaccine will likely be the point where the economy can then finish its snapback rally... just like how slightly downstream from that dam or waterfall a river tends to tighten back up, return to normal, and put the turbulence behind it.
There's a vision for how the economy recovers... but unfortunately, it doesn't come in the shape of a simple letter of the alphabet, and it doesn't look to be as easy as the market is currently pricing it to be. We'll be watching the data as we move forward to see if this forecast changes.
We'd love to hear your thoughts... Where you think the economy is headed? Let us know by sending an e-mail to [email protected].
In April, Congress signed off on a more than $3 trillion coronavirus relief package...
It's clear that the U.S. government will continue to spend massive amounts of money to keep businesses and individuals afloat during this time of forced economic contraction.
As a result, economists across the globe are concerned not for 2020... but 2021 and beyond. Many of these folks believe the real crisis will come after the rollout of a coronavirus vaccine...
After the pandemic is in the rear-view mirror, people will rush out to stores, restaurants, and concerts to spend all the money they didn't spend in 2020. However, this could be matched with a lack of supply, as factories, farms, and service centers would have been understaffed during the crisis.
This rise in demand and shock to supply would drive up prices, causing large amounts of destabilizing inflation.
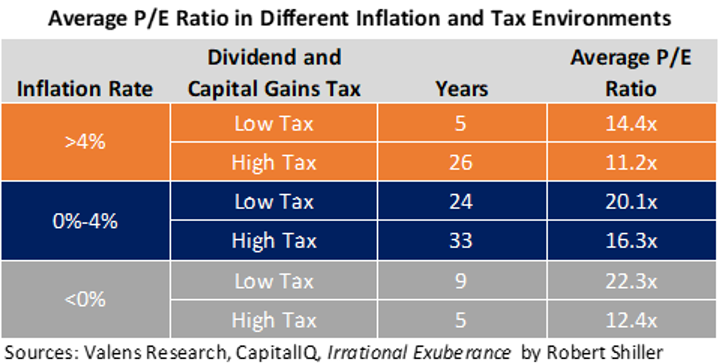
Not only would this inflation hit the wider economy, it would also affect valuations in the stock market. As we discussed in the March 9 Daily Authority, the tax environment and inflation will directly affect the market's average price-to-earnings (P/E) ratio.
As you can see in the chart below, inflation between 0% and 4% calls for valuations of 20.1 times in the current low-tax environment. Environments with inflation greater than 4% call for P/E ratios of 14.4x on average. Were rates to rise too high, stocks could drop by 34% as the P/E ratio falls from the current 21.9x level (on 2021 earnings) due to inflation pressures.
And that's before we even get into what could happen if we see a "blue sweep" of the presidency, House of Representatives, and Senate and taxes are raised to pay for current and future programs. In a high-tax, high-inflation environment, P/E ratios drop to 11.2.
For context, that would mean a 50% drop in valuations... before even calculating how lower earnings (due to higher taxes) would mean the P/E ratio was on a lower earnings number.
This is why economists and policymakers are concerned about the risk of a serious inflation-driven contraction. However, this scenario isn't backed up by the data... for two key reasons.
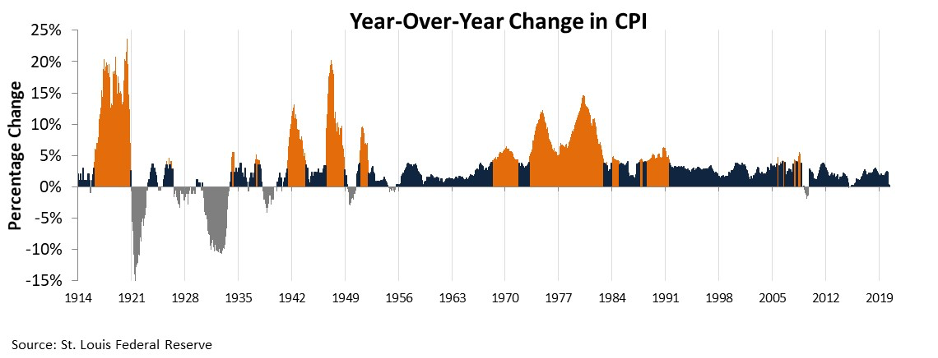
The first of these can be found in the measure of historic inflation over time. The next chart shows the year-over-year percentage change in the consumer price index ("CPI"). The CPI is a basket of goods which U.S. households tend to buy every year – such as groceries, apparel, and housing. It's meant as a proxy to track consumer inflation.
Since 1991, the U.S. has been able to keep down periods of high inflation. During the summer of 1996, the Federal Reserve privately began targeting an inflation rate of 2% to best facilitate economic growth.
Over the past 24 years, inflation has been low and consistent – the Fed has been successful in moderating inflation. As we discussed in the December 16 Daily Authority, high inflation in the 1970s led economist Milton Friedman to argue that inflation was tied closer to monetary policy (which can be controlled directly by the Fed). To a certain extent, the Fed has followed the playbook.
To highlight how inflation has been broken in the past 40 years, we can look at the 2008 economic crisis. After large stimulus packages, the economy saw no material change to inflation, despite the massive quantitative easing. This indicates that large stimulus packages can have little effect on inflation, if correct monetary policy is applied.
The second reason the U.S. isn't primed for an inflation crisis is because of the capacity utilization, which we talked about last week. Capacity utilization is currently sitting at 30-year lows.
This is traditionally a "red flag" for any economist... But in this situation, it means as a vaccine or treatment is rolled out in 2021, there won't be a huge supply shock on the economy. As the percentage of capacity utilization rises, supply will catch up with demand and prices will stay level.
This all means that inflation risk for the U.S. economy is low due to a history of successful monetary policy and cratering asset utilization. Inflation is unlikely to lead to a massive dip in the U.S. stock market.
Regards,
Joel Litman
July 27, 2020