I had a great time presenting for the U.S. Marine Corps last week...
On Wednesday, I was fortunate enough to be invited to give a presentation to the Marine Corps University ("MCU") in Quantico, Virginia. It's an honor to engage with the future leaders of our military... I was happy to accept the invitation... even if we weren't able to do the presentation in person.
So much of my time is spent talking to investors, so it's great to get a new perspective. I saw this at the MCU, as I have when giving seminars for the FBI, and even when speaking to students at U.S. Department of Defense schools in Okinawa, Japan, who were there with their parents deployed in the military.
My presentation was focused on the current global macro environment, how the U.S. capital markets look, and – most important – America's economic competitive positioning versus the rest of the world.
Considering the growth in the U.S. deficit, especially with the stimulus to defend the economy against the coronavirus pandemic, I wasn't surprised that one of the questions I got was around the country's debt-to-GDP ratio – whether this should be a concern, and how it could impact America's economic competitive position globally.
The reality is that the answer is more nuanced than just talking about the sum of U.S. government debt. What's far more important than that total principal due is the government's ability to service its debt.
It's likely the U.S. will never pay off the debt, and will just keep on refinancing it. As the economy grows – and it will grow again in the future – the debt-to-GDP ratio will drop, thus reducing the debt load. But the U.S. has to pay the interest on the debt, and that obligation is what's important when thinking of how it could impact the economy.
When the president signed the $2 trillion CARES Act stimulus package, none of that is being funded by new revenue for the U.S. government – it's all going to come from debt. But how much interest will the U.S. pay on the $2 trillion in debt?
A back-of-the-envelope calculation says the government will pay less than $20 billion annually...
Every part of the U.S. Treasury yield curve other than the 20-year and 30-year bonds are below 1%. The 10-year Treasury yield is 0.63%, and the five-year is 0.31%. And finally, U.S. government tax revenue in 2019 was $3.46 trillion.
Finding the money to pay for that $10 billion or $20 billion of interest shouldn't be that challenging as long as interest rates don't rise dramatically.
To the question of what happens if interest rates rise... well, there are reasons not to be worried about that. We'll save that discussion for a future issue of Altimetry Daily Authority.
But it's refreshing to see how our future military leaders are also thinking about these economic issues... just as investors are.
The market is driven by human behavior, and that can sometimes help make it predictable...
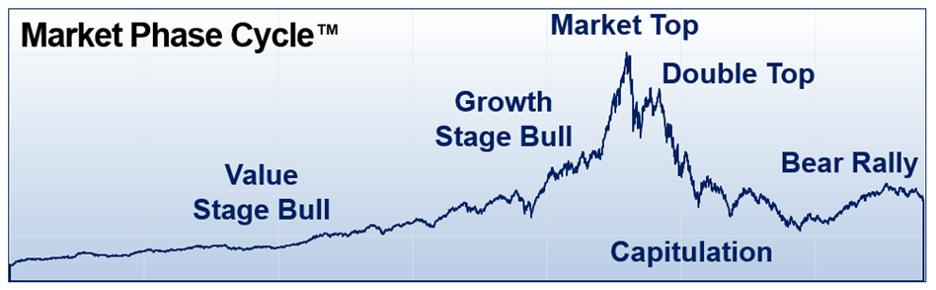
For some time now, we've been teaching the Market Phase Cycle as part of our MBA classes. And one of the major things we go over in this discussion is the repetition of the same pattern, over and over again in stock market bear and bull cycles. You can see it below...
You always see a market top. Then, after a sell-off, you see another "double top" that doesn't always perfectly match the actual top, but it still occurs. You then see the sell-off and capitulation, a bear market rally, and finally... the move higher.
You can look at a chart of the market crash of 1929, the Nasdaq Composite Index in 2000, the S&P 500 Index in 2008, China's market in 2008, bitcoin in 2018, or even all the way back to the South Sea bubble in the early 18th century. Time and time again, the chart repeats.
We've never explained the "why" of that specific pattern. We talk about how credit cycles are the core drivers of this pattern – pushing economic growth higher and lower – and how that powers earnings growth and valuation trends. But that doesn't explicitly explain why this exact pattern happens over and over again.
That was until one of our students in class, a doctor getting his MBA, walked up to us and said that the pattern reminded him of a chart he looked at all the time: a normal sine-wave heartbeat you see on an EKG. Take a look...
For us, this was a great "aha moment." Anyone who has studied behavioral psychology would immediately say "of course" when seeing this chart... just as we did.
Naturally, the market is an aggregate of a collection of humans acting in their own self-interest, so it would begin to take on the characteristics of the people who are part of it. The market has a "heartbeat."
And understanding that heartbeat can give us a powerful perspective into broader trends in the market... especially during times like right now.
Last Monday, the Nasdaq closed roughly 4% off its all-time highs. That is a historic rally, considering the continued near-term uncertainty in the market. It also looks an awful lot like a double top.
And as investing great Sir John Templeton said:
The four most expensive words in the English language are, "this time it's different."
So investors should be expecting a rollover in the market. Stocks are likely to see at least a partial "retest" – if not a full retest, or even new lows – in the coming months.
The news that will be the catalyst may be:
- A slower economic reopening than everyone is hoping for,
- A second wave of coronavirus infections,
- The realization of how bad March, April, and May have been for the global economy and for corporate earnings, or possibly even
- Weaker companies in pressured sectors like travel, retail, and oil going bankrupt
All of those are reasonable scenarios that weren't priced in to U.S. equities on February 19 – the all-time high for the Nasdaq. If the index was only 4% off all-time highs, how could they have been?
So be prepared... We'll see a pullback from the current levels. The market isn't yet "all clear."
But here's the real question: Will it be a partial retest for the Nasdaq and the S&P 500, a full retest of mid-March lows, or will we make new, lower lows?
For that, we need to look to the exact parts of the Market Phase Cycle playbook that we laid out in mid-March during the midst of the worst of the panic, and even earlier in late February as the market started to roll over.
First and foremost, we need to watch the credit cycle. That will help us understand if things are about to get much worse, or if we're getting a natural, healthy retest of the market lows that should help bring on capitulation ahead of the market moving higher in the back half of the year.
Two key things will determine if things get worse... and they're both related to the credit markets.
First is if businesses need access to credit and can't get it, and the second will be if credit costs rise so high so as to freeze companies out of the market.
Neither of those things appear to be a risk. As we highlighted in late April, corporate debt maturity schedules have largely been pushed off to two to five years from now. That means that corporations aren't in desperate need to access markets to refinance their debts.
On top of that, many companies have ample revolver liquidity, and banks may be willing to waive normal restrictive financial covenants in order to provide near-term liquidity while some of these businesses are basically shut down. This gives us confidence that a retest doesn't necessarily mean things are getting significantly worse.
On top of that, as we highlighted in mid-April, the cost to borrow for U.S. corporations – which had risen in mid-to-late March – has dropped down to levels that are low relative to history.
In the middle of last month, the average cost to borrow for high-yield credits was around where it had been in mid-2019. Today, it's back down to levels approaching historic lows.
U.S. corporations were able to issue more than $280 billion in debt in April. That's a staggering amount of debt... and it was at favorable interest rates. That doesn't sound like a closed credit market.
And for U.S. individuals, their balance sheets were relatively healthy before the crisis. They won't be as healthy coming out of the crisis – even with the stimulus check help from the government – as people need to use credit cards and savings for essential purchases as opposed to trips and splurges. But thanks to where we entered this pullback, individual balance sheets aren't nearly as stressed as they were in 2007 and 2008 prior to the financial crisis.
Of course, if the market starts to roll over, the cost to borrow is going to rise in sympathy as both markets react. But if corporations already have the liquidity they need – even though some weaker companies in specific industries like travel, retail, and oil might struggle – the market should be OK overall.
That won't prevent the pullback... but it does help qualify how bad it will be.
As we always do, we'll continue to monitor all these statistics here at Altimetry and will let you know if anything changes that makes our view change. But this information should prime you for the inevitable pullback before it happens, so you can remember to be data-driven in the midst of a move lower.
Remember, it's data that give us context about how to be positioned in the market... and keep us sane when the market panics.
Regards,
Joel Litman
May 18, 2020