A popular investing metric is broken...
Investors commonly use the price-to-earnings (P/E) ratio to quickly understand a company's valuation. The same can be done for the benchmark S&P 500 or any other index to understand how cheap or expensive the entire stock market is.
In the March 23 Altimetry Daily Authority, we talked about economist Robert Shiller and his attempt to clean up the market P/E ratio through his cyclically adjusted price-to-earnings ("CAPE") ratio.
The CAPE ratio – also known as the Shiller P/E ratio – seeks to eliminate the "noise" in earnings by taking the moving average of the previous 10 years of earnings.
However, this metric is flawed... for two key reasons.
First, the CAPE ratio makes no adjustment to as-reported earnings. No matter how strong the model, if garbage goes in, then garbage will come out.
Second, the ratio is out of touch with market fundamentals due to its backwards-looking earnings metric. The market values companies not on previous performance, but future expected earnings. This means the backwards-looking CAPE ratio is distorted by previous earnings movement, such as when earnings were pressured in 2008 during the financial crisis.
A few weeks ago, Fidelity Investments published an article about the stock market valuation, using a modified CAPE ratio. The modified ratio considers interest rates, the risk premium of stocks, and the effect of dividends and buybacks on earnings to attempt to clean up this metric.
That is important because the Shiller P/E Ratio doesn't take into account the effect of inflation or taxes on the average P/E ratio, and discount rate. As we discussed in early March and on Monday, average P/E ratios can range between 11 times and 22 times depending on the inflation level and tax rate in the U.S. This factor pollutes the results of a backward-looking P/E calculation if these factors aren't accounted for.
This is a core issue with the CAPE ratio that all these modifications call to attention, instead of fixing. If investors need to make considerable changes to a model to make it relevant, perhaps that model isn't very useful in the first place...
As a backwards-focused metric, the CAPE ratio doesn't consider the market's expectations for any potential changes in either of these two key factors. Also, by not taking into account context when analyzing valuations, the CAPE ratio misses the boat on its real insights.
This multitude of factors to "modify" the CAPE ratio are narrow solutions to fix a model without a working premise.
Here at Altimetry, we completely sidestep this issue of a backwards-looking ratio to focus on the current market P/E – which is forward-looking. More important, by viewing earnings through a Uniform Accounting framework, we then see a more accurate picture of the market's true pricing.
Many of the greatest innovations in history were the products of intense competition and a race to patent...
Alexander Graham Bell and Elisha Gray competed to invent the telephone in 1876. It was Bell who finished first and arrived at the patent office just a few hours before Gray, cementing himself in history.
Similarly, the Wright brothers' invention of the airplane in 1903 was the culmination of a worldwide race to the skies. Their 12-second flight beat out other aspiring inventors from Paris to Brazil, ushering in the era of air travel. They weren't innovating in a vacuum.
Thomas Edison is commonly known as the inventor of the light bulb, but his design wasn't the first electric light ever created. Early versions were flawed, and he beat out inventor Joseph Swan to patent a more viable version... so Edison gets the credit as the inventor of the light bulb.
All these famous inventions came about as the result of competition between great minds. In many cases, these inventors weren't even the first to come up with their ideas.
Bell adopted his telephone patent from Gray's earlier work. The Wright brothers were arguably preceded by two years in flight by Gustave Whitehead. Finally, Edison simply built off the works of others to create a more efficient version.
Competition tends to bring out the best, and drives people or businesses to new heights. The absence of this race to the top can lead companies and inventors to become complacent.
Following the patenting of their airplane, the Wright brothers went into business to monetize their invention. With the sole patent for the airplane design, they were content with focusing on securing their riches... without the same engineering rigor that propelled them into flight first.
By 1911, the Wright brothers' planes were considered to be inferior to European competitors. And in 1913, a series of fatal crashes brought their contract with the U.S. Army to an end, effectively eroding the multiyear head start they had on the competition. Without the competitive race to market, the Wright brothers were too complacent, ending their competitive edge.
Like these famous inventors before them, Nike (NKE) has thrived from competition, having successfully navigated the highly competitive footwear and apparel industry since 1964. The company had largely forced its German competitor Adidas (ADDYY) into niche status within the U.S. market.
Nike seemed to have a firm grasp on the U.S. apparel and footwear market, when upstart competitor Under Armour (UA) came bursting onto the scene with its initial public offering ("IPO") in 2005. Under Armour started taking market share from Nike in the late 2000s – signing hugely successful pro athletes from the NFL's Tom Brady to the NBA's Steph Curry.
In 2016, Under Armour signed UCLA to the biggest collegiate deal in history at $280 million, building a presence in colleges and stores across the country. The company had overtaken Adidas as the second-largest sports apparel company in the U.S. and had its sights set firmly on Nike.
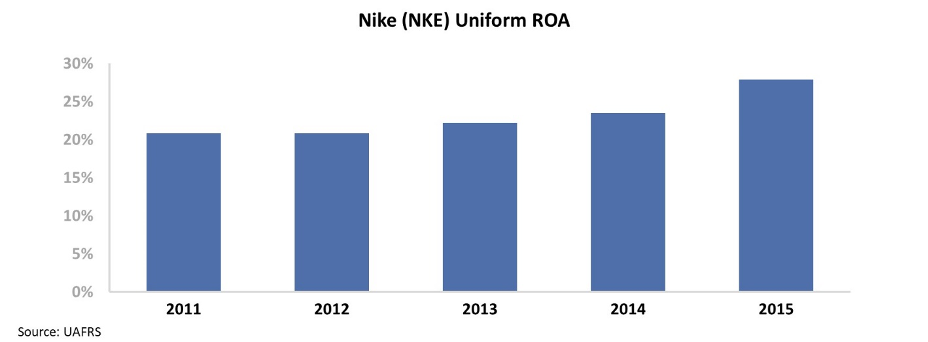
It would be easy to assume Under Armour's success would have pressured Nike's returns during Under Armour's ascent from 2010 to 2015...
However, the Uniform metrics show a different reality. Nike raised its game and saw ROA improvement. Much like the races to patent inventions, the presence of a strong competitor can drive companies to improve operations and returns well above normal levels.
Nike's Uniform ROAs expanded from 21% in 2011 to 28% in 2015, coinciding with Under Amour's five-year stretch of huge growth...
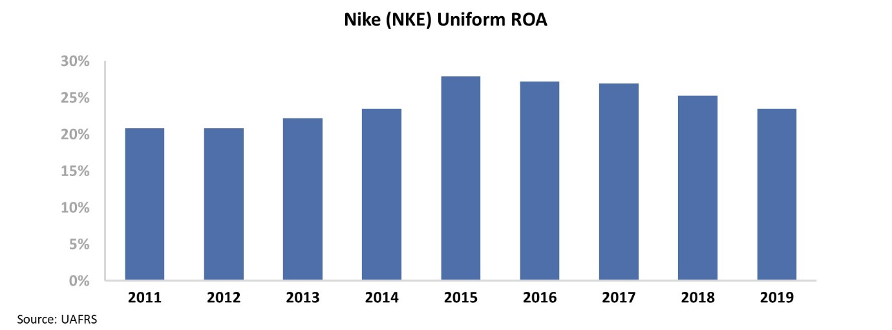
Since 2015, Under Armour has languished with poor returns... and its shares have fallen 80%. The company lost its momentum in the face of Nike's withering competition. As it struggled, it stopped being such an existential threat to Nike's dominance.
This appears to have had a direct effect on Nike. As the company was once again able to rest on its laurels, Nike's Uniform ROAs have declined once more. The real returns have fallen from the highs of 28% in 2015 down to 24% last year...
As Nike got comfortable with its dominant position again, management wasn't pushed as it had been when Under Armour was a threat.
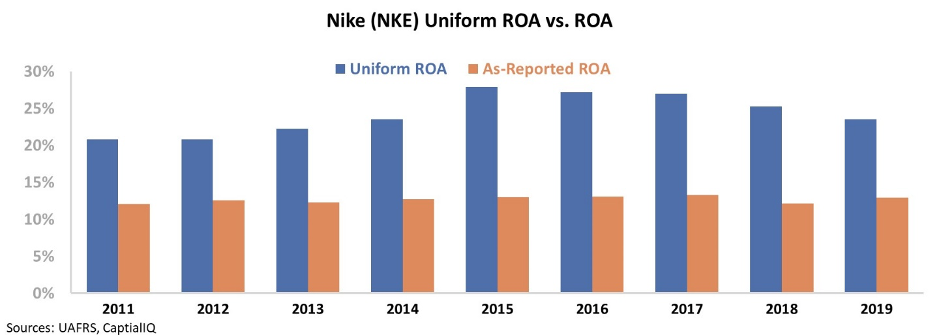
This powerful picture helps explain why competition is so important for companies, just as it is for inventors and in other fields. And yet, investors using as-reported metrics would have missed this entire story.
GAAP distortions make it appear that Nike's performance was unchanged by Under Armour, both in the midst of competition and after its competitor faltered. Take a look...
The Nike story parallels that of many famous inventors, who competed to secure patents before they lost their edge after the competition dissipated. Uniform Accounting allows us to see the whole story – where Nike improves its returns consistently in the face of competition... before seeing ROA decline in the years when the competition is gone.
Perhaps investors should hope for another "Nike killer" to appear on the scene. It may actually create shareholder value for Nike... not destroy it.
Regards,
Rob Spivey
July 29, 2020
P.S. Which companies would you like to see us cover here at the Daily Authority? Send us a name via e-mail to [email protected] and we may add it to the queue to highlight.