Let's take a quick pulse of the credit market...
Back in September, we laid out some of the key drivers that cause credit crises – the catalysts for deep bear markets and recessions.
One of these drivers is the high cost to borrow that freezes corporations out of the credit market. As we explained, the low cost to borrow in 2019 had extended the market and credit cycle.
There have recently been significant discussions about credit spreads widening – indicating that the cost to borrow is getting much higher for corporations. It's a bad signal for this short-term disruption getting much worse.
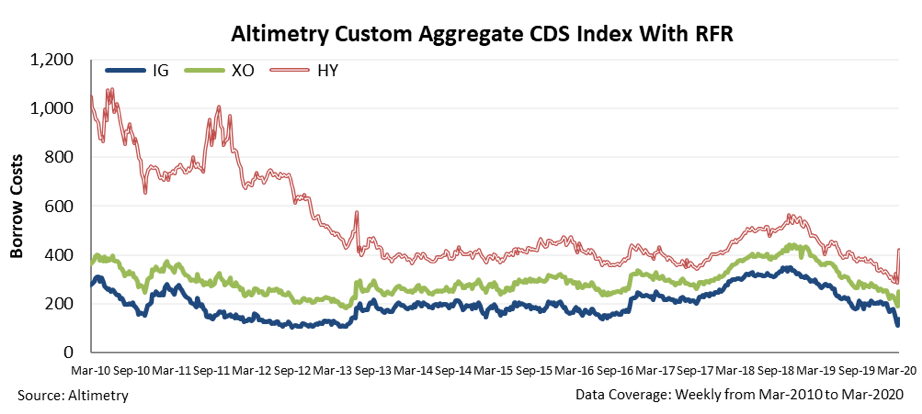
As such, let's revisit the chart we shared on credit default swap ("CDS") prices plus the risk-free rate ("RFR") over the past decade to see where we stand today. It breaks CDSs into three buckets: investment grade ("IG"), crossover ("XO"), and high yield ("HY").
As you can see, the cost to borrow has recently spiked significantly for high-yield credits – in line with what people have talked about in the market.
But there are always two incredibly important variables... Not just change (or rate of change), but also level.
Thanks to the reduction in the RFR – due to the Federal Reserve cutting interest rates – the cost to borrow for corporations had dropped massively ahead of this spike. Many people are trying to point to this as a reason to panic.
But the reality is that the spike in cost to borrow for high-yield credits has just shifted back to around their cost to borrow in September... when we were declaring that the low cost to borrow was incredibly bullish!
Of course, this cost could rise higher in the short term... but based on all the other factors we've talked about previously – including in the March 13 Altimetry Daily Authority – we think this short-term disruption is unlikely to get worse. And as the chart shows, it's not as bad as many fear-mongers are trying to make it out to be.
We'll continue to update and revisit the prior macro pieces we wrote over the coming days and weeks to give you context on the fundamentals underpinning this market. Again, though, don't panic from what people are yelling about on TV... but let the data drive your investing process instead.
It's no secret we don't like as-reported data...
Many of the reports you see here at Altimetry highlight different problems we see with traditional financial numbers.
In total, we make more than 130 individual adjustments to GAAP and IFRS accounting statements in order to make Uniform Accounting as powerful as it is.
We aren't the first to come up with the idea of adjusting as-reported financial statements. Some of the greatest investors throughout history have talked about how unreliable most accounting standards can be.
In the opener of the March 11 Daily Authority, we even talked about how legendary investor Warren Buffett recently coined the term "accounting land" to describe the make-believe world of as-reported financial statements.
He went on to say that he believes "accounting land" has nothing to do with Berkshire Hathaway's (BRK-B) "real" performance – highlighting the problems with the as-reported numbers.
And some academics have tried adjusting traditional metrics to better understand the market, which have yielded mixed results.
Professor Aswath Damodaran from NYU Stern argues for the need to adjust items like research and development (R&D) expense and operating lease expense in order to calculate "real" earnings...
As regular readers know, we make similar adjustments. That said, not every adjustment to as-reported metrics is useful.
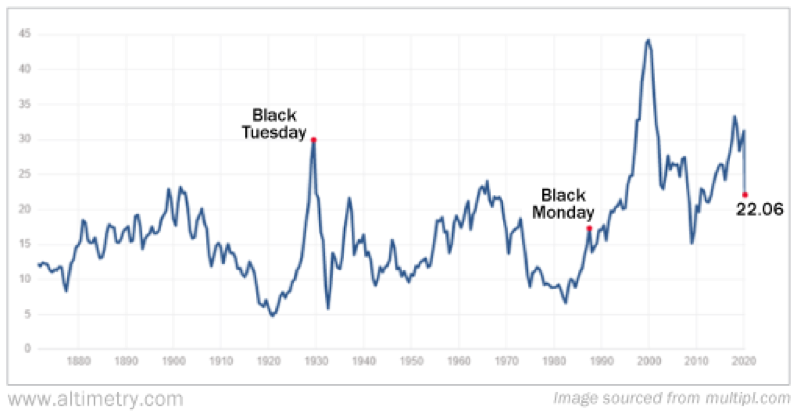
Today, let's focus on Yale Professor and Nobel Prize winner Robert Shiller and his proposed adjustment to the as-reported price-to-earnings (P/E) ratio – the Shiller P/E, also referred to as the cyclically adjusted price-to-earnings ("CAPE") ratio.
Shiller proposes that the standard P/E ratio is too volatile because it only looks at one year of earnings. Instead, the Shiller P/E ratio takes current share prices divided by a moving average of the past 10 years of earnings.
The argument is one year of earnings has the potential to be impacted by too many external factors, including different stages in the business cycle. By looking at a 10-year average, the CAPE ratio removes the impact of business cycles and it lessens the impact of any one year of earnings.
This can help us avoid the problem of having P/E ratios reach their highest point when companies are actually their cheapest, which is a phenomenon we'll likely talk about in a future macro article. In the chart below, you can see the steep drop in the CAPE ratio in the wake of the recent market volatility...
While the CAPE ratio helps to smooth the impact of market volatility over a longer period of time, we don't agree that this is the biggest issue with as-reported P/E.
There's an argument to be made for reducing the impact of volatile as-reported earnings, but this isn't the way we would choose to solve it.
The biggest issue the CAPE ratio fails to address is earnings. It chooses to use a 10-year average of earnings, but it still uses as-reported numbers. These aren't reflective of economic reality because they punish companies for activities like investing in R&D, leasing assets, and issuing employees non-cash stock options.
Because of the misleading treatment of these important activities, it doesn't matter how many years of earnings you use. If you're looking at garbage earnings, there's no difference between a single year or a 10-year average.
Additionally, the CAPE ratio makes use of past earnings. We've previously discussed why it's important to use forward earnings... but as a reminder, valuations are based on what investors think companies are going to do in the future, not based on what they've done in the past.
This puts the CAPE ratio fundamentally out of touch with what market valuations should be measuring, regardless of whether it's using good data or not.
Considering these shortfalls, we respectfully don't see the value in metrics like the CAPE ratio for understanding how cheap or expensive the market is.
Regards,
Joel Litman
March 23, 2020