As long as demand for low-interest bonds remains high, interest rates won't rise – which will fuel growth...
Last week, Bloomberg published an article explaining that $8.7 trillion of sovereign bonds maturing this year are likely to be rolled over.
The piece highlights that even with that refinancing, investors can't find enough safe bonds to invest in. As such, they continue to pile into any low-risk, investment-grade debt.
As we talked about back in September, when the cost to borrow is low and access to credit remains easy, corporations, individuals, and governments can refinance their debts.
It's creditors' inability to pay their debts when they come due – not their inability to service interest expense – which causes credit crises, recessions, and major bear markets. If creditors can refinance their debts, they don't have to worry about paying them.
As long as the cost to borrow remains low for creditors, they're likely to continue refinancing their debts – just as they did last year after a tougher 2018. That means continued tailwinds that enable this market to rise higher.
With investors desperate to find debt with any yield, that macro indicator is unlikely to go negative anytime soon.
Valuation ratios are tools to get an answer, not answers in and of themselves...
We often use valuation ratios to help explain our thesis on a company. Regular Altimetry Daily Authority readers know we frequently talk about metrics like price-to-earnings (P/E) ratios or price-to-book (P/B) ratios.
We like to include valuation ratios in our analyses because they have three main advantages:
- They're quick to calculate. Rather than spending hours building a complicated model that forecasts a company's growth, cash flows, and investment strategies, a P/E ratio can be calculated in a matter of minutes or seconds.
- You can easily compare these metrics across time and between different companies. For example, when looking at peer companies like apparel retailers Nike (NKE) and Under Armour (UAA), it can be useful to know that Nike trades at a P/E of 32 times, while Under Armour trades higher at 40 times. Additionally, for a business like Nike, it can be useful to know that the company is currently trading at its highest P/E ratio ever.
- They're in real-time. While traditional financial models can only be updated every few months when management releases a company's quarterly financial statements, valuation ratios update in real-time as the stock price rises and falls. This means it's possible to react faster when new information comes out about a company.
But to date, we have mostly talked about P/E ratios in a very specific way...
For businesses like CF Industries (CF) and Carlisle (CSL), we've talked about how you can look at a company's P/E ratio to say whether the company is "cheap" or "expensive."
In our write-up on CF Industries, we saw that the company's P/E was around an expensive 30 times... while Carlisle's P/E ratio of 16 indicated that the company was cheap.
In both of these cases, we were talking about how expensive the businesses were in relation to the market. The market-average P/E is around 20 times, so comparing a company's ratio to 20 can be a quick and dirty label for "cheap" or "expensive."
However, this isn't the only way to look at valuation ratios... A P/E at or below 20 times is not inherently better than a P/E ratio of 30, 50, or 100.
Put another way, the P/E ratio can also be looked at as a tool to evaluate market expectations for a company. In many cases, this lines up with the cheap versus expensive narrative, but not always.
One example of this is in technology startups like Zendesk (ZEN). Zendesk is a young software startup, and as such, does not have strong returns... yet.
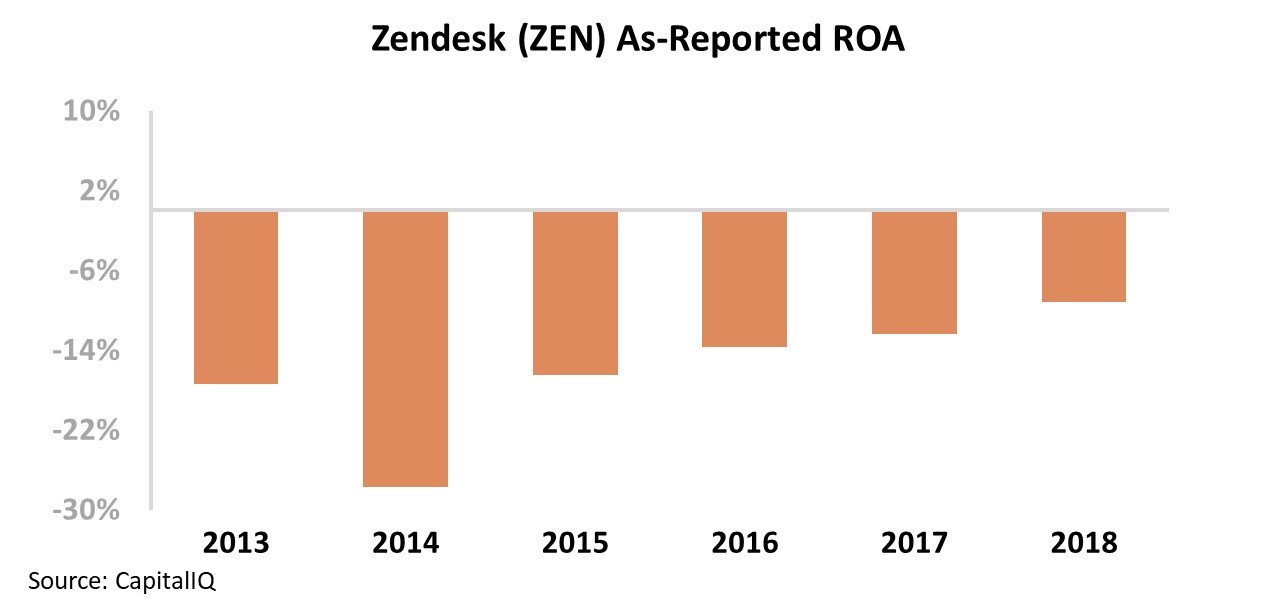
On an as-reported basis, Zendesk has had a negative return on assets (ROA) in each of its first five years as a public company. While the story has been improving – as ROA has moved closer to breakeven in each of the past five fiscal years – this is still not a great sign for investors.
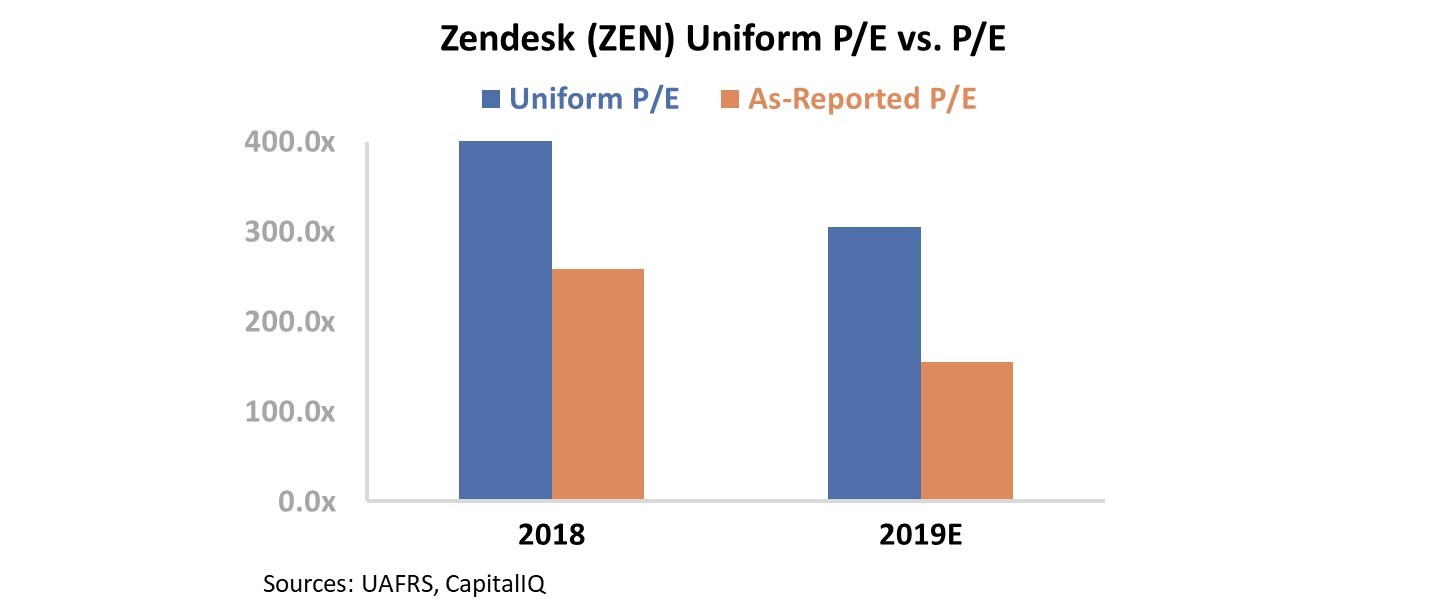
It's no surprise, then, that in the way we normally discuss P/E ratios, the company looks expensive. It's trading at roughly 150 times earnings today...
But that's not the only way to interpret the P/E ratio. The first thing we need to do is make sure we're looking at the right numbers. Once we look at Zendesk's financials using Uniform Accounting metrics – adjusting for inconsistencies that tend to impact startups like the treatment of non-cash stock option expenses – we can see that the company is actually trading at nearly twice as high a P/E. As you can see, Zendesk sports a Uniform P/E ratio of more than 300...
When thinking about the P/E ratio as a gauge for expectations, this means investors have even higher expectations for Zendesk than we may have originally thought.
Once we look at the company's Uniform ROA, this begins to make sense...
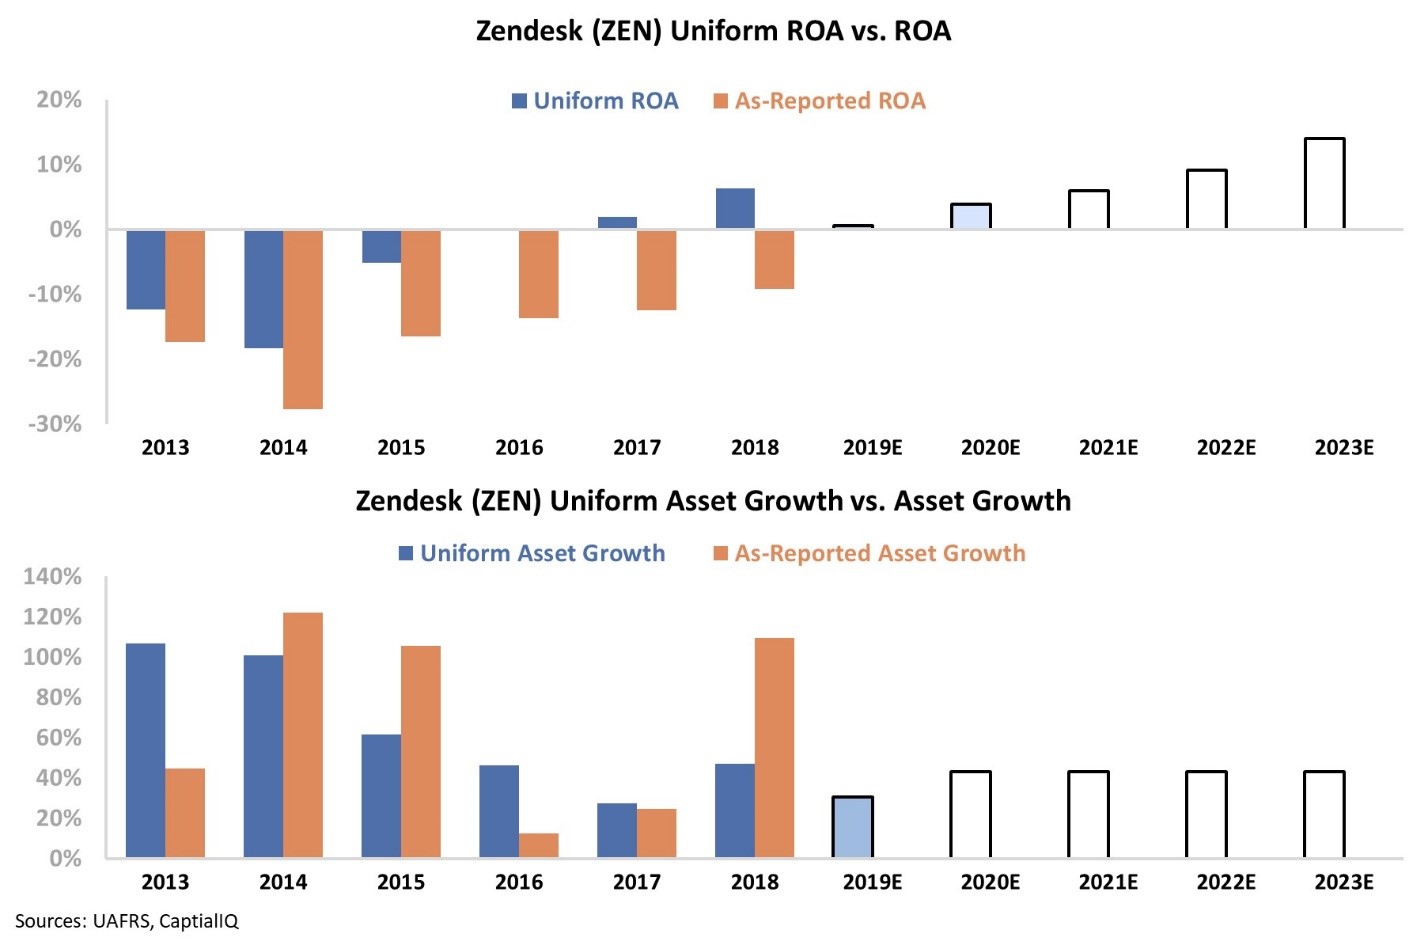
The chart below shows Zendesk's historical corporate performance levels in terms of ROA and asset growth (dark blue bars) versus what sell-side analysts think the company is going to do over the next two years (light blue bars) and what the market is pricing in at current valuations (white bars). As you can see, Zendesk is already a profitable company... but investors would miss this using as-reported metrics.
Additionally, even at current valuations, investors are only expecting Zendesk to be slightly above average – with its ROA expanding to a maximum of 14%. The company has also grown by an average of 65% annually since going public. Investors expect this to remain at 40% going forward, which is likely attainable for a tech startup.
You don't have to run from a company just because its P/E ratio is high... As long as it's justified, that can be a compelling reason to stay in the name. If Zendesk grows by 40% in the next year, Uniform ROA continues to improve modestly, and its P/E ratio stays at 300 thanks to continued strong execution, the company's stock will be 40% higher at the end of the year than it is now.
Even though current valuations imply investors have high expectations for Zendesk, that's not the same as saying the company is overvalued. Furthermore, these signals may not even make sense if you looked at traditional ROA alone.
Zendesk isn't necessarily a screaming buy, but just because it trades at a P/E ratio of 150 or a Uniform P/E ratio of 300 doesn't make it a short. This means expectations are high.
Regards,
Joel Litman
January 8, 2020