Editor's Note: We wrote this note to our premium subscribers yesterday and wanted to make sure all our readers heard these thoughts this morning after a rough day in the market and a challenging start to the year thus far.
 We have understandably been getting a lot of questions from our readers and institutional clients who are nervous about the market...
Since the beginning of the year, the Nasdaq is down 25%, the Russell 2000 is down 20%, and the S&P 500 is down 16%. From all-time highs, they're down 26%, 16%, and 27%, respectively.
If you were just invested in the S&P 500, you've had 13 months of gains wiped out. You're back where you were in early April 2021.
For small-cap and microcap investors, which the Russell 2000 represents, the pain has been even more severe. All gains since November 2020, 18 months ago, are down the tubes.
That has a direct impact on your wealth, and considering the context, we understand your fear.
Inflation is rampant. In March, inflation hit a 40-year high – the highest it has been since 1981. With China locking down its economy in waves due to its zero-Covid policy and Russia's invasion of Ukraine upsetting raw material supply chains, the market is worried supply chain issues could keep inflation high.
The Federal Reserve has begun its most aggressive rate hike schedule. The last time it hiked rates by 50 basis points in one meeting was May 2000... after the economy had already entered a recession.
The last time the Fed raised rates 3% in a hiking cycle, as the market thinks Chairman Jerome Powell will do this time, was almost two decades ago, from 2003 to 2006.
The interest rate on the 10-year Treasury has risen over 160 basis points in less than six months. Mortgage rates have moved from 3% to 5.25% at a staggering speed.
The 40-year bull market in interest rates may finally be at its end.
Higher rates stifle credit creation and economic growth. And real gross domestic product ("GDP") growth was negative in the first quarter.
The ISM Purchasing Managers' Index ("PMI") appears to be rolling over after peaking in 2021, both in the U.S. and globally. This metric shows that while investment remains strong, it may be slowing on the margin.
And as one of our institutional investor clients observed in a meeting last week, we're also in the middle of one of the toughest periods of year-over-year growth comparison... pretty much ever.
Said more plainly, the market is panicked and we can understand why.
If it's in the news, it's in the market...
All those headlines justifiably call into serious question where economic growth is headed. They're also why the market is already down in the double digits.
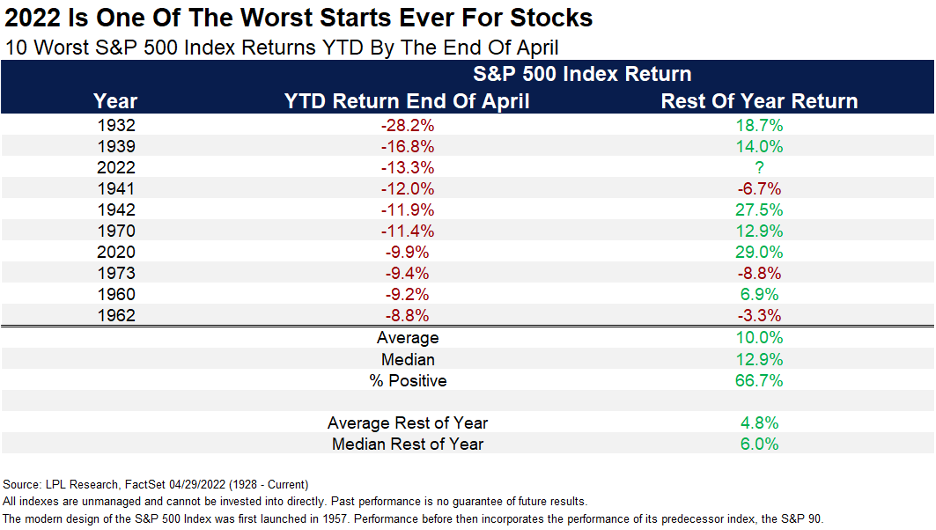
Last week, LPL Financial (LPLA) published a very thoughtful piece on how bad the market has been this year and what to expect going forward.
The piece highlighted how the average peak to trough of a drawdown in the S&P 500 since World War II is 133 days. We're now 122 days into the current correction for the S&P 500.
This goes hand in hand with the statistic that when the market has historically started out this poorly, normally there is also a strong bounce back for the rest of the year.
And as we've highlighted regularly, LPL Financial also noted that a bear market in the S&P 500 is exceptionally rare without a recession occurring. It's so rare the last nonrecessionary bear market was 35 years ago. And when that happened in 1987, much of it could be attributed to the craziness of Black Monday, when the market dropped over 20% in a day.
The likelihood of that type of black swan event happening again in the future is not something you should make investment decisions around.
The question now is: Are these headlines going to get worse before they get better?
After all, that's what will help dictate where the market goes next.
And that's where having a systematic process comes into place. Instead of panicking about those headlines, you can react to the full picture.
On inflation, we talked just last week about why many datapoints say inflation may already have peaked. The headlines here are likely to be more positive on the margin going forward, not more negative.
As President of the Minneapolis Fed Neel Kashkari noted recently in an interview, the Fed has already moved mortgage rates by 225 basis points since the cycle started tightening, effectively removing accommodation in the housing market faster than it eased it in 2020.
Similarly, with the 10-year Treasury yields already having risen from around 1.4% in December to almost 3.1% today – and from levels as low as 1.13% last July – the market has already priced in 200 basis points of the Fed's rate hikes.
On the margin, interest rates will likely rise slower going forward, not faster, limiting incremental punishment for new potential borrowers.
And with the 10-year Treasury having risen so far so fast, banks are in a prime position to make money, as we discussed previously. Banks are making a massive spread between what they're lending out in either mortgages or corporate borrowing relative to how much it costs them to finance their balance sheets in the short-term market.
That means banks are likely to continue to make credit easily available for borrowers who want it at these rates. Datapoints like the Senior Loan Officer Survey also highlight how banks are very happy to make credit available right now.
And while the market cost to borrow for corporations for new borrowings or refinancings has rocketed higher in the past few months with the rise in the risk-free rate, it remains in line with levels for much of the last bull market. Cost to borrow isn't high.
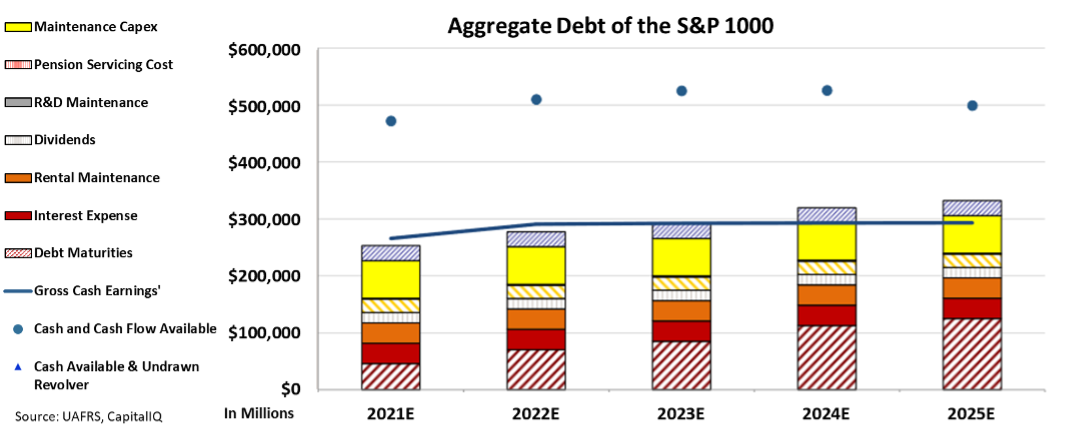
And importantly, as this chart we've shown many times before highlights, most corporations don't have big debt maturity headwalls to refinance until 2024 or 2025 at the earliest. As massive defaults are the consistent catalyst for a recession, the market still stands on a strong bedrock.
And lastly, PMI statistics are notoriously volatile in the short term. The bigger picture datapoints we look at on investment actually have us more bullish, not less.
As we discussed yesterday, old assets on U.S. corporate balance sheets have helped create the current supply chain issues... and that's pushing U.S. corporates to finally reinvest.
And, if we look at one of the most trusty indicators of investment – commercial & industrial (C&I) loan growth – we're actually seeing signs that investment is accelerating, not decelerating.
We're also seeing that confirmed by management teams, who are showing significant confidence in earnings calls about their willingness to invest, based on our Earnings Call Forensics analyses.
It's always darkest before the dawn...
And now feels like one of those times. Investors have been beaten up by challenging headlines. Those in some of the most popular stocks in the market have been even more punished due to valuations deflating.
When a move like this happens, human nature is to worry that the worst is yet to come, to cut tail, and run.
When you feel that way, often the best course of action is to do quite the opposite. Pause, collect all the data, and look forward.
It doesn't quite paint the visual of Baron Nathan Rothschild's alleged quote, "Buy when there's blood in the streets," but the meaning is much the same.
Because when headlines and stocks are all red, but data on the margin looks like it's improving, smart investors stay the course and take advantage to buy the dip.
Best,
Joel Litman and Rob Spivey
May 10, 2022